Dow Jones Industrial Average finds a thin rebound on Tuesday
- The Dow Jones is looking for a foothold after a broad-market downturn.
- Equities are widely higher on Tuesday, but still at the bottom of a long hole.
- Investors continue to pine for Fed rate cuts, but “emergency cut” appears off the table.

The Dow Jones Industrial Average (DJIA) recovered ground on Tuesday, rallying around 700 points after the index spent several days facing steep declines vefore settling back into the 300-point region to wrap up the US trading session. Investors are recovering their balance after a broad downturn in key US economic data sent risk sentiment into the gutter and reignited broad-market fears of a recession within the US.
Markets have regained their composure after sending the Dow Jones for a 7% backslide from last week’s peak near 41,200.00, but Dow Jones bidders will have their work cut out for them to get price action back into the high end. The flow of US economic data has eased for the time being, but hopes for rate cuts from the Federal Reserve (Fed) continue to simmer in the background.
Rate markets have fully priced in a September rate cut, and according to the CME’s FedWatch Tool, investors see two-to-one odds of a double cut for 50 basis points when the Federal Open Market Committee (FOMC) delivers its rate call on September 18. At the current cut, rate markets see zero chance of the Fed holding rates steady anymore in 2024, with a total of four quarter-point cuts expected by the end of the year.
Dow Jones news
A majority of the Dow Jones index was in the green on Tuesday, with roughly one-third of its constituent securities holding stubbornly in the red. Losses were initially led by Intel Corp. (INTC), which recently missed revenue estimates and reduced its forward guidance on 3rd quarter earnings. Citing slim margins and difficult profitability, Intel revenues fell by 1% to a total of $12.8 billion in the second quarter, missing analyst forecasts by $150 million.
Upon revealing the decline in revenues and missed forecast, Intel announced they would be suspending a December dividend payout and laying off around 10% of their workforce, or around 15,000 people. This comes after Intel received upwards of $8.5 billion dollars of government grants earlier in the year, with the potential for another $11 billion in further grants down the line.
Dow Jones technical outlook
The Dow Jones successfully staved off further declines as broad-market sentiment recovers its footing, keep the index above the 200-day Exponential Moving Average (EMA) at 37,934.50. However, the DJIA remains well off of all-time highs set in July at 41,371.38 and buyers have a long climb back into record peaks.
The 50-day EMA lies in wait above intraday price action at 39,632.50, while bidders will be looking to keep prices bolstered above the 38,500.00 level after Monday’s technical bounce from the price level.
Dow Jones daily chart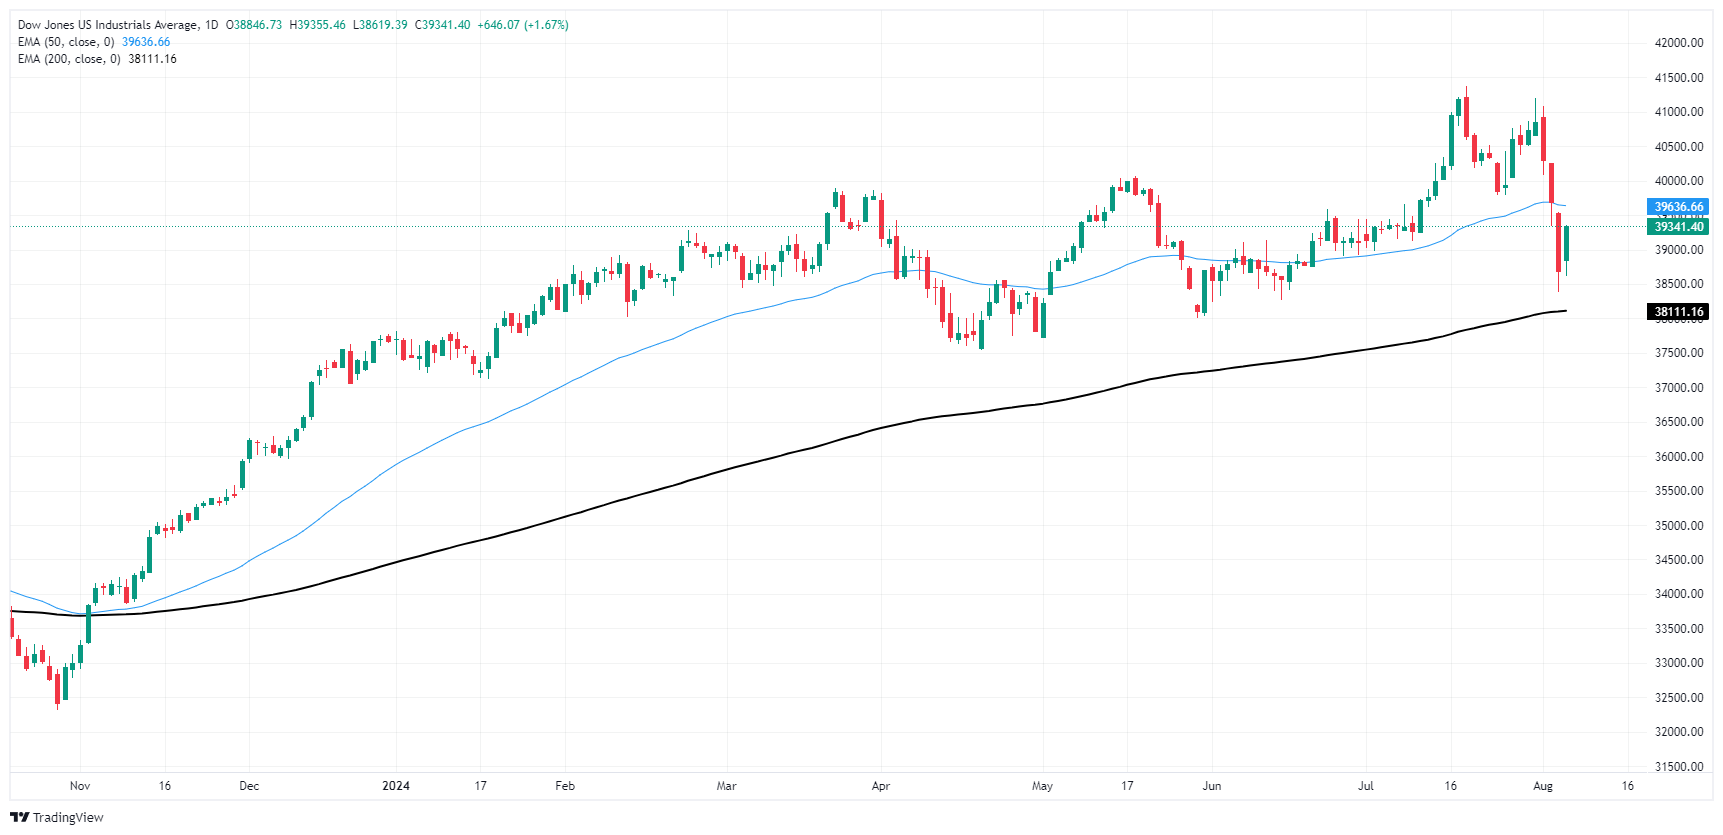
Dow Jones FAQs
The Dow Jones Industrial Average, one of the oldest stock market indices in the world, is compiled of the 30 most traded stocks in the US. The index is price-weighted rather than weighted by capitalization. It is calculated by summing the prices of the constituent stocks and dividing them by a factor, currently 0.152. The index was founded by Charles Dow, who also founded the Wall Street Journal. In later years it has been criticized for not being broadly representative enough because it only tracks 30 conglomerates, unlike broader indices such as the S&P 500.
Many different factors drive the Dow Jones Industrial Average (DJIA). The aggregate performance of the component companies revealed in quarterly company earnings reports is the main one. US and global macroeconomic data also contributes as it impacts on investor sentiment. The level of interest rates, set by the Federal Reserve (Fed), also influences the DJIA as it affects the cost of credit, on which many corporations are heavily reliant. Therefore, inflation can be a major driver as well as other metrics which impact the Fed decisions.
Dow Theory is a method for identifying the primary trend of the stock market developed by Charles Dow. A key step is to compare the direction of the Dow Jones Industrial Average (DJIA) and the Dow Jones Transportation Average (DJTA) and only follow trends where both are moving in the same direction. Volume is a confirmatory criteria. The theory uses elements of peak and trough analysis. Dow’s theory posits three trend phases: accumulation, when smart money starts buying or selling; public participation, when the wider public joins in; and distribution, when the smart money exits.
There are a number of ways to trade the DJIA. One is to use ETFs which allow investors to trade the DJIA as a single security, rather than having to buy shares in all 30 constituent companies. A leading example is the SPDR Dow Jones Industrial Average ETF (DIA). DJIA futures contracts enable traders to speculate on the future value of the index and Options provide the right, but not the obligation, to buy or sell the index at a predetermined price in the future. Mutual funds enable investors to buy a share of a diversified portfolio of DJIA stocks thus providing exposure to the overall index.
Author

Joshua Gibson
FXStreet
Joshua joins the FXStreet team as an Economics and Finance double major from Vancouver Island University with twelve years' experience as an independent trader focusing on technical analysis.