Dow Jones Industrial Average cracks fresh all-time peak on Monday as Fedspeak drives sentiment
- Dow Jones breached into a new all-time high of 40,346.22 on Monday.
- Fedspeak continues to dominate market attention as traders await cuts.
- Rate markets see 98% chance of September rate cut according to CME’s FedWatch.

The Dow Jones Industrial Average (DJIA) rallied into a new all-time peak on Monday, clipping into 40,346.22 before settling back into the day’s opening range near 40,200.00 as markets continue to weigh the odds of a future rate cut from the Federal Reserve (Fed). Fed Chairman Jerome Powell gave a nod of the head on Monday at recent progress on inflation data, helping to spark further hope for a September rate cut and prompting broad-market considerations of an even earlier cut in July.
Fed's Powell: Decisions to be made on a meeting-by-meeting basis
According to the CME’s FedWatch Tool, rate markets are pricing in 98% odds of at least a quarter-point rate trim to the fed funds rate when the Federal Open Market Committee (FOMC) meets on September 18. Interest rate traders broadly see the Fed holding steady when the FOMC meets later this month on July 31. Still, a few particularly rate-cut-hungry market participants are pricing in around 7% odds of an early quarter-point rate trim.
After a steep deceleration in Consumer Price Index (CPI) inflation last week which sparked a fresh rally in rate cut hopes, markets are shrugging off a concerning uptick in Producer Price Index (PPI) wholesale inflation. The next bout of US economic data to watch will be Tuesday’s US Retail Sales, which markets expect to flatten to 0.0% MoM in June compared to the previous month’s 0.1%.
Dow Jones news
The Dow Jones is one of the better-performing major equity indexes on Monday, climbing over 200 points bottom-to-top in Monday’s early surge before settling back into the day’s opening range near 40,200.00. Roughly half of the DJIA’s constituent securities are in the green for the day, with Caterpillar Inc. (CAT) climbing nearly 3% to $345.41 per share and is up a stellar 54% from its 52-week low of $223.76 set in November of last year.
Nike Inc. (NKE) is leading the losers to the bottom of the Dow Jones index, slumping -2.2% to $71.80 per share on Monday. Nike Inc. continues to bled investor interest after the company revised forward guidance sharply lower at the shoe manufacturer’s latest earnings reporting. Nike shares have tumbled -41% from last December’s peak of $123.39 per share, and has fallen below $72.00 per share for the first time since 2018.
Dow Jones technical outlook
The Dow Jones is holding close to the 40,200.00 handle on Monday after setting a fresh record high, and bidders are trying to keep price action propped up above the 40,000.00 major handle. Daily candlesticks continue to hold on the high side of the 200-day Exponential Moving Average (EMA) rising towards 38,000.00.
The Dow Jones has held on the bullish side of the long-term moving average since breaking north of the 200-day EMA back in early November, and the major equity index is up nearly 20% from last October’s bottom near 32,313.50.
Dow Jones five minute chart
Dow Jones daily chart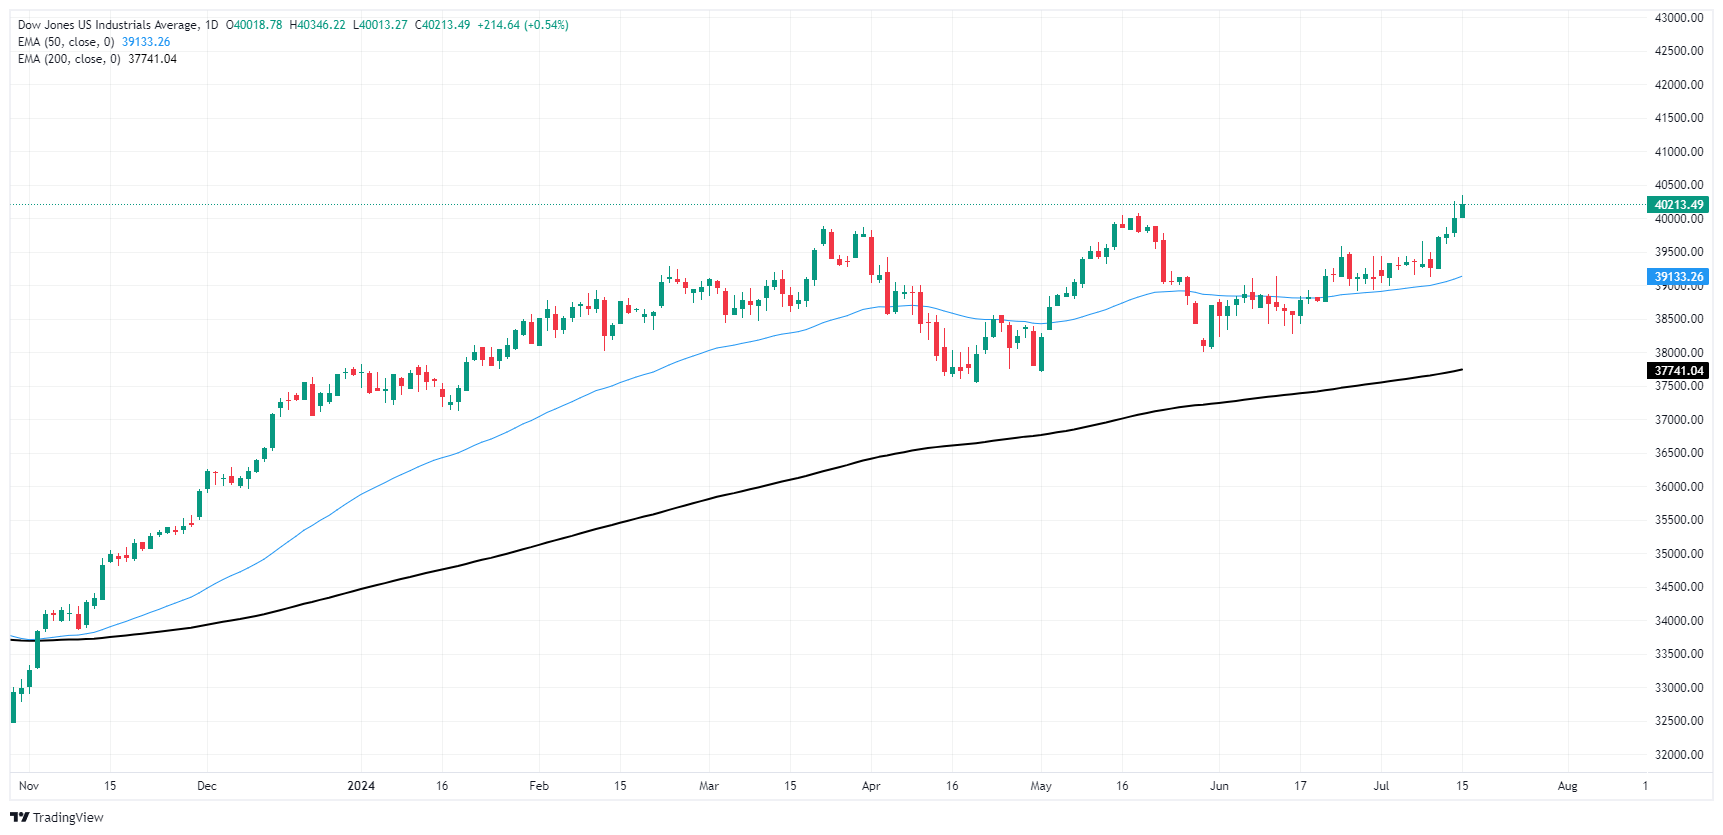
Dow Jones FAQs
The Dow Jones Industrial Average, one of the oldest stock market indices in the world, is compiled of the 30 most traded stocks in the US. The index is price-weighted rather than weighted by capitalization. It is calculated by summing the prices of the constituent stocks and dividing them by a factor, currently 0.152. The index was founded by Charles Dow, who also founded the Wall Street Journal. In later years it has been criticized for not being broadly representative enough because it only tracks 30 conglomerates, unlike broader indices such as the S&P 500.
Many different factors drive the Dow Jones Industrial Average (DJIA). The aggregate performance of the component companies revealed in quarterly company earnings reports is the main one. US and global macroeconomic data also contributes as it impacts on investor sentiment. The level of interest rates, set by the Federal Reserve (Fed), also influences the DJIA as it affects the cost of credit, on which many corporations are heavily reliant. Therefore, inflation can be a major driver as well as other metrics which impact the Fed decisions.
Dow Theory is a method for identifying the primary trend of the stock market developed by Charles Dow. A key step is to compare the direction of the Dow Jones Industrial Average (DJIA) and the Dow Jones Transportation Average (DJTA) and only follow trends where both are moving in the same direction. Volume is a confirmatory criteria. The theory uses elements of peak and trough analysis. Dow’s theory posits three trend phases: accumulation, when smart money starts buying or selling; public participation, when the wider public joins in; and distribution, when the smart money exits.
There are a number of ways to trade the DJIA. One is to use ETFs which allow investors to trade the DJIA as a single security, rather than having to buy shares in all 30 constituent companies. A leading example is the SPDR Dow Jones Industrial Average ETF (DIA). DJIA futures contracts enable traders to speculate on the future value of the index and Options provide the right, but not the obligation, to buy or sell the index at a predetermined price in the future. Mutual funds enable investors to buy a share of a diversified portfolio of DJIA stocks thus providing exposure to the overall index.
Author

Joshua Gibson
FXStreet
Joshua joins the FXStreet team as an Economics and Finance double major from Vancouver Island University with twelve years' experience as an independent trader focusing on technical analysis.


