Dow Jones Industrial Average slips amid high US yields, Fed rate cut odds increase
- Dow Jones dips from 42,500 as US Treasury yields rise.
- US job openings drop to lowest level since January 2021, supporting rate cut bets.
- Consumer Confidence jumps to 108.7, the highest since March 2021.
- Boeing leads Dow gains, up 2.93% after share sale, while Chevron, Coca-Cola and Home Depot post notable losses.

The Dow Jones Industrial Average (DJIA) trims off Monday’s gains, retreating from daily highs near 42,500 and down over 0.25%. US Treasury bond yields cling to gains. US jobs market data augmented the odds that the Federal Reserve (Fed) will cut interest rates at the November meeting, while Consumer Confidence improved sharply.
US bond yields continued to rise as the 10-year Treasury note yield rose three-and-a-half basis points to 4.32% after the US Department of Labor revealed that job openings in the US tumbled to their lowest level in three-and-a-half years.
US job vacancies slumped to 7.44 million in September from 7.86 million a month before, the fewest job openings since January 2021. At the same time, the Conference Board showed that Americans grew the most optimistic about the economy as the index increased from 99.2 to 108.7, its most strongly gain since March 2021.
Following the data, the CME FedWatch Tool shows odds for a 25-basis-point (bps) rate cut by the Fed jumping to 98%, up from 96% a day ago. This would leave rates in the 4.50%-4.75% range.
Dow Jones news
The earnings season continued on Tuesday. Among the leading companies that compose the Dow Jones Industrial Average, McDonald’s (MCD) reported earnings per share (EPS) of $3.23, above estimates of $3.20. Revenue was also above forecasts of $6.82 billion at $6.87 billion. Despite this, MCD clings to minuscule gains of 0.03% at $296.88 per share.
In the meantime, Boeing (BA) raised over $21 billion via its share sale on Monday, selling 112.5 million shares at $143.00 each as the company prepares to repair its balance sheet.
Following the share sale, Boeing was the foremost leader in the session, gaining 2.93% at $155.10 per share, followed by Salesforce (CRM), up 1.31% at $297.61 a share, and Cisco Systems (CSCO), up 0.94% at $55.80. The laggard of the session was Chevron (CXP), losing 1.14% to $148.82; Coca-Cola (KO), down by 1.27% to $65.82 a share; and Home Depot (HD) edged 1.80% lower to $395.65.
Dow Jones price forecast
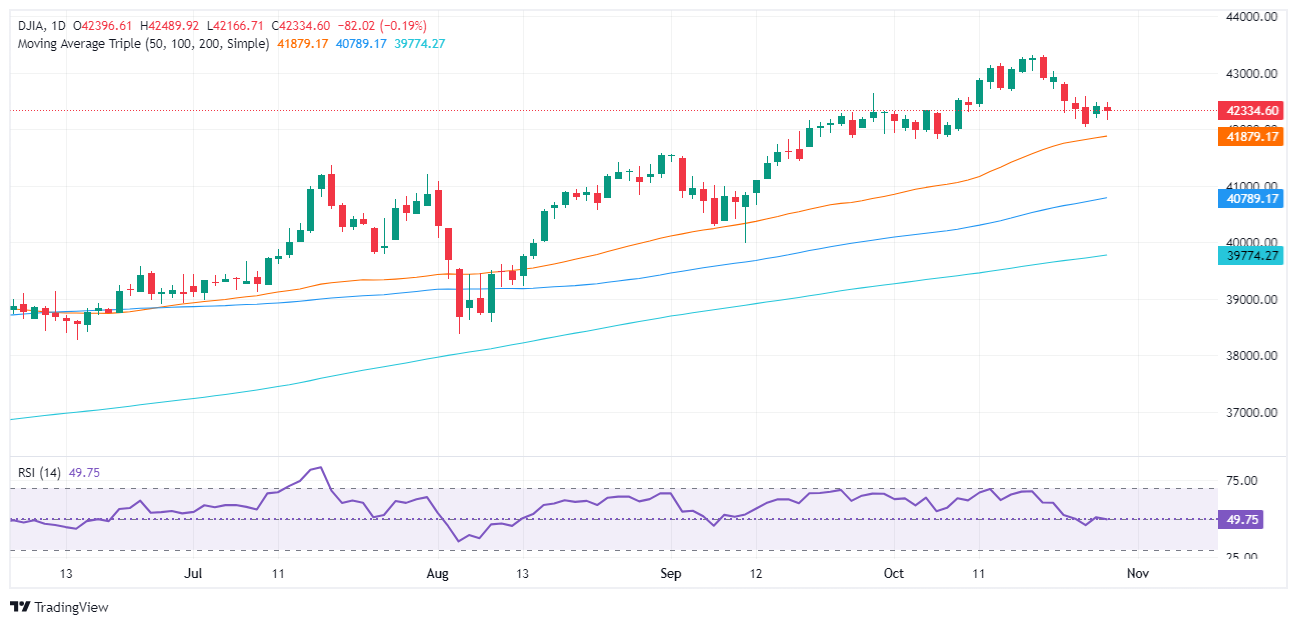
The Dow Jones consolidated just below the 42,350 area for the second straight day after forming an “inside day,” which could have opened the door for further upside. However, the DJIA slipped below Monday’s close, paving the way for further downside.
If sellers move in and push the DJIA below the October 25 swing low of 42,043, look for a test of the 42,000 mark. Up next lies the 50-day Simple Moving Average (SMA) at 41,879.
For a bullish continuation, the DJIA must clear the October 25 peak at 42,596. Once surpassed, the next resistance would be 43,000, followed by a record high at 43,322.
Momentum remains bullish as depicted by the Relative Strength Index (RSI), which pierced above its neutral line. This hints that buyers bought the dip and are eyeing higher levels.
Dow Jones daily chart
Dow Jones FAQs
The Dow Jones Industrial Average, one of the oldest stock market indices in the world, is compiled of the 30 most traded stocks in the US. The index is price-weighted rather than weighted by capitalization. It is calculated by summing the prices of the constituent stocks and dividing them by a factor, currently 0.152. The index was founded by Charles Dow, who also founded the Wall Street Journal. In later years it has been criticized for not being broadly representative enough because it only tracks 30 conglomerates, unlike broader indices such as the S&P 500.
Many different factors drive the Dow Jones Industrial Average (DJIA). The aggregate performance of the component companies revealed in quarterly company earnings reports is the main one. US and global macroeconomic data also contributes as it impacts on investor sentiment. The level of interest rates, set by the Federal Reserve (Fed), also influences the DJIA as it affects the cost of credit, on which many corporations are heavily reliant. Therefore, inflation can be a major driver as well as other metrics which impact the Fed decisions.
Dow Theory is a method for identifying the primary trend of the stock market developed by Charles Dow. A key step is to compare the direction of the Dow Jones Industrial Average (DJIA) and the Dow Jones Transportation Average (DJTA) and only follow trends where both are moving in the same direction. Volume is a confirmatory criteria. The theory uses elements of peak and trough analysis. Dow’s theory posits three trend phases: accumulation, when smart money starts buying or selling; public participation, when the wider public joins in; and distribution, when the smart money exits.
There are a number of ways to trade the DJIA. One is to use ETFs which allow investors to trade the DJIA as a single security, rather than having to buy shares in all 30 constituent companies. A leading example is the SPDR Dow Jones Industrial Average ETF (DIA). DJIA futures contracts enable traders to speculate on the future value of the index and Options provide the right, but not the obligation, to buy or sell the index at a predetermined price in the future. Mutual funds enable investors to buy a share of a diversified portfolio of DJIA stocks thus providing exposure to the overall index.
Author

Christian Borjon Valencia
FXStreet
Markets analyst, news editor, and trading instructor with over 14 years of experience across FX, commodities, US equity indices, and global macro markets.


