Dow Jones Industrial Average rebounds after a loss-heavy week, rallies hard into Friday close
- Dow Jones rebounds from lows near 38,000.00 after heavy backslide.
- Market sentiment recovering as rate cut hopes rise once again.
- US PCE Price Index inflation cools faster than expected.

The Dow Jones Industrial Average (DJIA) rebounded nearly 580 points on Friday as investor sentiment turned higher after US Personal Consumption Expenditures (PCE) Price Index inflation eased faster than expected. Rate markets are once again pricing in better-than-even odds of a September rate cut from the Federal Reserve (Fed). The Dow Jones is also getting bolstered by a strong rebound in Salesforces Inc. (CRM) after the management company missed revenue expectations for the first time since 2006, sparking a steep 20%+ decline in the stock.
US PCE Price Index inflation eased to 0.2% MoM in April, coming in below the forecast steady hold at 0.3%. US Personal Spending also declined more than expected in April, falling to just 0.2% MoM versus the forecast 0.3% and further down from the previous month’s revised 0.7%.
With inflation pressures showing further signs of cooling, investors are once again pivoting to hopes for a September rate cut from the Fed’s Federal Open Market Committee (FOMC). According to the CME’s FedWatch Tool, rate markets are pricing in only a 48% chance of no rate change in September.
Dow Jones news
The Dow Jones is broadly higher on Friday, with all but two of the index’s constituent securities in the green for the day. Amazon Inc. (AMZN) slid -1.6% to $176.44 per share despite announcing progress on Amazon’s planned drone delivery services. Investors remain skeptical that the delivery company will be able to see returns on its automated delivery plans.
Salesforce Inc. (CRM) is up 7.54% on Friday, trading at $234.44 per share as the stock slowly recovers from a harsh selloff earlier in the week. CRM backslid over -20% this week after the management software company missed earnings expectations by $40 million dollars. CRM reported Q1 revenues of $9.133 billion, an 11% increase YoY, while median analyst estimates expected revenue of $9.145 billion. CRM also issued lowered forward guidance for growth and earnings as the long-standing company struggles to find new customer markets to break into.
Dow Jones technical outlook
The Dow Jones is rebounding from steep near-term declines, testing into 38,380.00 after hitting a fresh May low near 38,000.00 this week. The major equity index has declined in all but three of the last ten consecutive trading days, and the DJIA is still down -4.2% from record highs set just above 40,000.00 on May 20.
The Dow Jones is still trading north of the 200-day Exponential Moving Average (EMA) at 37,220.72, but sharp near-term declines leave the index far below all-time highs and grappling with short pressure.
Dow Jones five minute chart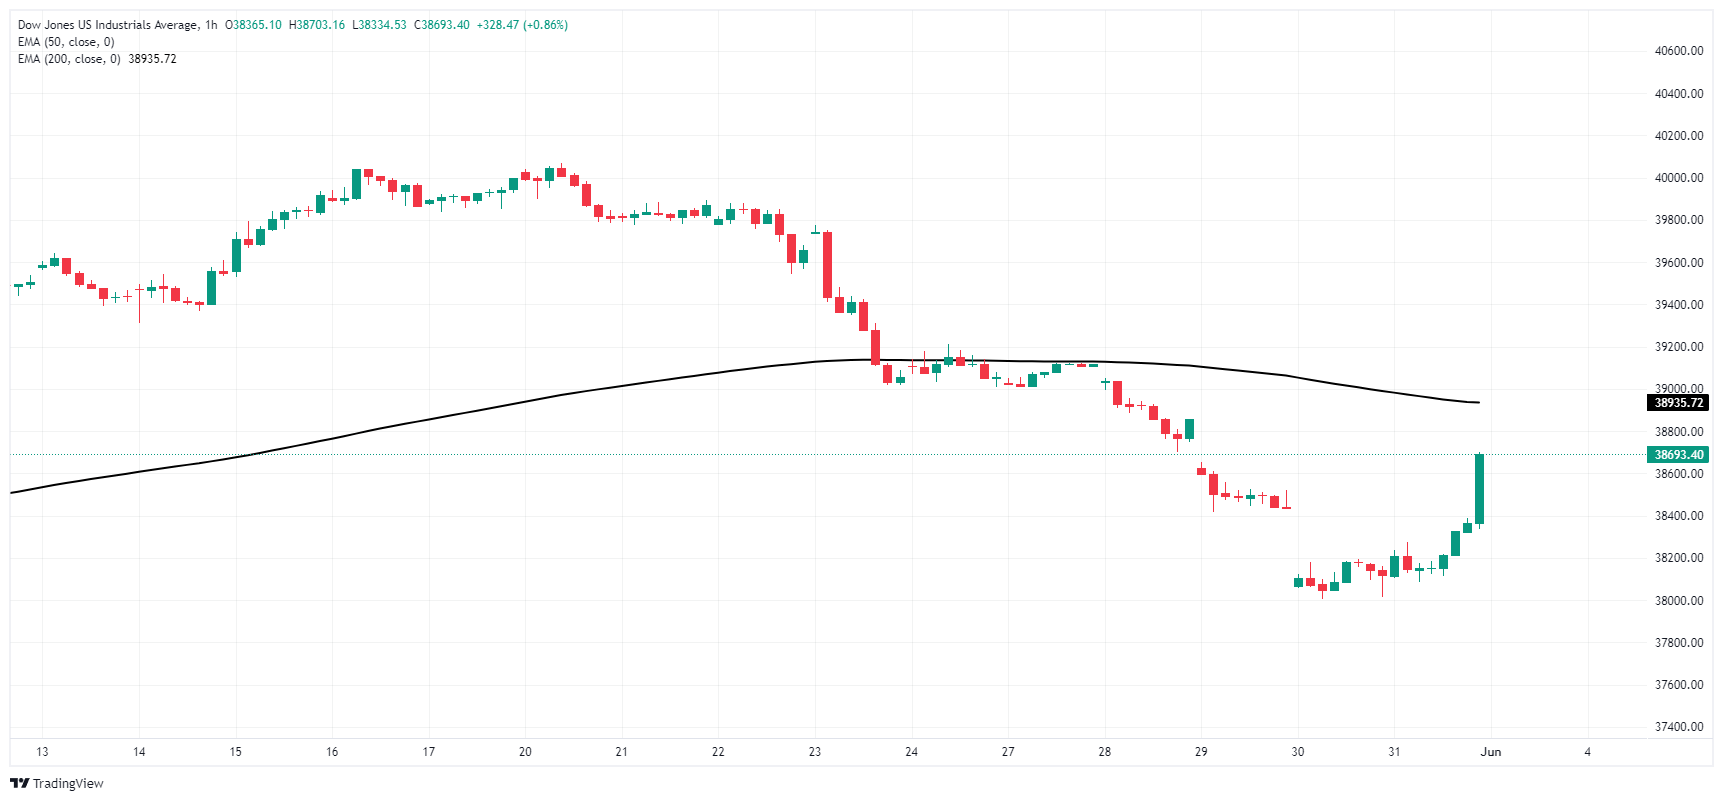
Dow Jones daily chart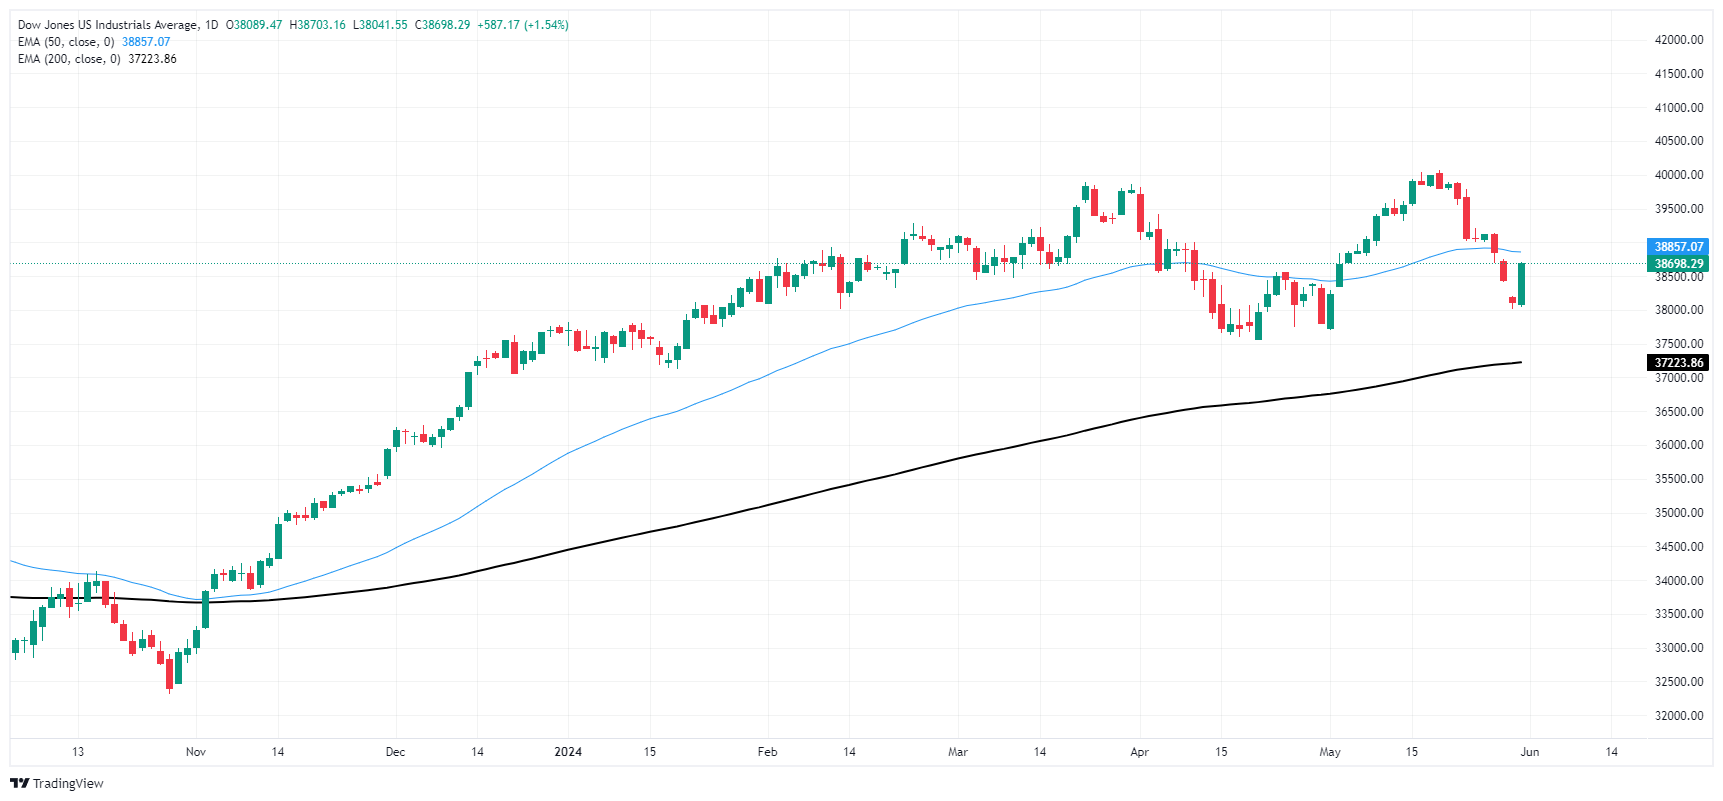
Dow Jones FAQs
The Dow Jones Industrial Average, one of the oldest stock market indices in the world, is compiled of the 30 most traded stocks in the US. The index is price-weighted rather than weighted by capitalization. It is calculated by summing the prices of the constituent stocks and dividing them by a factor, currently 0.152. The index was founded by Charles Dow, who also founded the Wall Street Journal. In later years it has been criticized for not being broadly representative enough because it only tracks 30 conglomerates, unlike broader indices such as the S&P 500.
Many different factors drive the Dow Jones Industrial Average (DJIA). The aggregate performance of the component companies revealed in quarterly company earnings reports is the main one. US and global macroeconomic data also contributes as it impacts on investor sentiment. The level of interest rates, set by the Federal Reserve (Fed), also influences the DJIA as it affects the cost of credit, on which many corporations are heavily reliant. Therefore, inflation can be a major driver as well as other metrics which impact the Fed decisions.
Dow Theory is a method for identifying the primary trend of the stock market developed by Charles Dow. A key step is to compare the direction of the Dow Jones Industrial Average (DJIA) and the Dow Jones Transportation Average (DJTA) and only follow trends where both are moving in the same direction. Volume is a confirmatory criteria. The theory uses elements of peak and trough analysis. Dow’s theory posits three trend phases: accumulation, when smart money starts buying or selling; public participation, when the wider public joins in; and distribution, when the smart money exits.
There are a number of ways to trade the DJIA. One is to use ETFs which allow investors to trade the DJIA as a single security, rather than having to buy shares in all 30 constituent companies. A leading example is the SPDR Dow Jones Industrial Average ETF (DIA). DJIA futures contracts enable traders to speculate on the future value of the index and Options provide the right, but not the obligation, to buy or sell the index at a predetermined price in the future. Mutual funds enable investors to buy a share of a diversified portfolio of DJIA stocks thus providing exposure to the overall index.
Author

Joshua Gibson
FXStreet
Joshua joins the FXStreet team as an Economics and Finance double major from Vancouver Island University with twelve years' experience as an independent trader focusing on technical analysis.


