Dow Jones Industrial Average pares recent losses on Thursday
- The Dow Jones rallied 260 points on Thursday as investors recover footing.
- US data came in broadly better than expected, easing recession fears.
- Despite a litany of Fed speakers, almost none addressed monetary policy.

The Dow Jones Industrial Average rebounded around 260 points on Thursday, with investors reinvigorated after US economic data eased rising fears of an economic slowdown. A better-than-expected Durable Goods Orders print has assuaged fears that the Federal Reserve (Fed) might have aggressively cut rates last week in response to a deteriorating economic outlook. However, investors will still be keeping a close eye on monthly jobs report figures in the coming weeks.
US Durable Goods Orders held flat at 0.0% in August, well below the previous month's revised 9.9%, but still beat the forecast of a 2.6% contraction. Initial Jobless Claims for the week ended September 20 also beat forecasts, printing at 218K versus the expected 225K and easing down from the previous week's revised 222K.
The recent 50 bps rate cut by the Federal Reserve (Fed) has caused some concerns in global markets. Some investors are worried that the large rate cut might be a response to a potential economic slowdown in the US. However, Fed Chair Jerome Powell stated last week that the rate cut was not a hasty reaction to signs of a recession, but rather a proactive measure to support the US labor market.
US Durable Goods Orders and week-on-week Initial Jobless Claims helped to bolster the Fed head's case, with both figures printing better than expected and the "soft landing" economic rhetoric holding steady. However, Friday's Personal Consumption Expenditure (PCE) inflation print will draw plenty of attention, and will be the real test of last week's Fed rate cut.
Dow Jones news
The Dow Jones is tilted firmly into the bullish side on Thursday, with over two-thirds of the equity index firmly planted in the green. Caterpillar (CAT) is trading firmly higher on the day, rising 3.6% near $392 per share following reports that China has unveiled another massive stimulus package meant to reinvigorate the Chinese housing and construction industries, a move that Caterpillar is widely expected to benefit from.
Dow Jones price forecast
Despite Thursday’s bullish tilt, the Dow Jones is struggling to make headway after the midweek’s bearish pullback. Still, price action is within arm’s reach of recent all-time highs, and bidders will have their sights set on the next leg up.
Dow Jones buyers have stubbornly staked their claim on the 42,000 handle, shrugging off signs of overbought conditions. On the low side, sellers will be looking to drag the equity board back down toward the 50-day Exponential Moving Average (EMA) near 40,870.
Dow Jones daily chart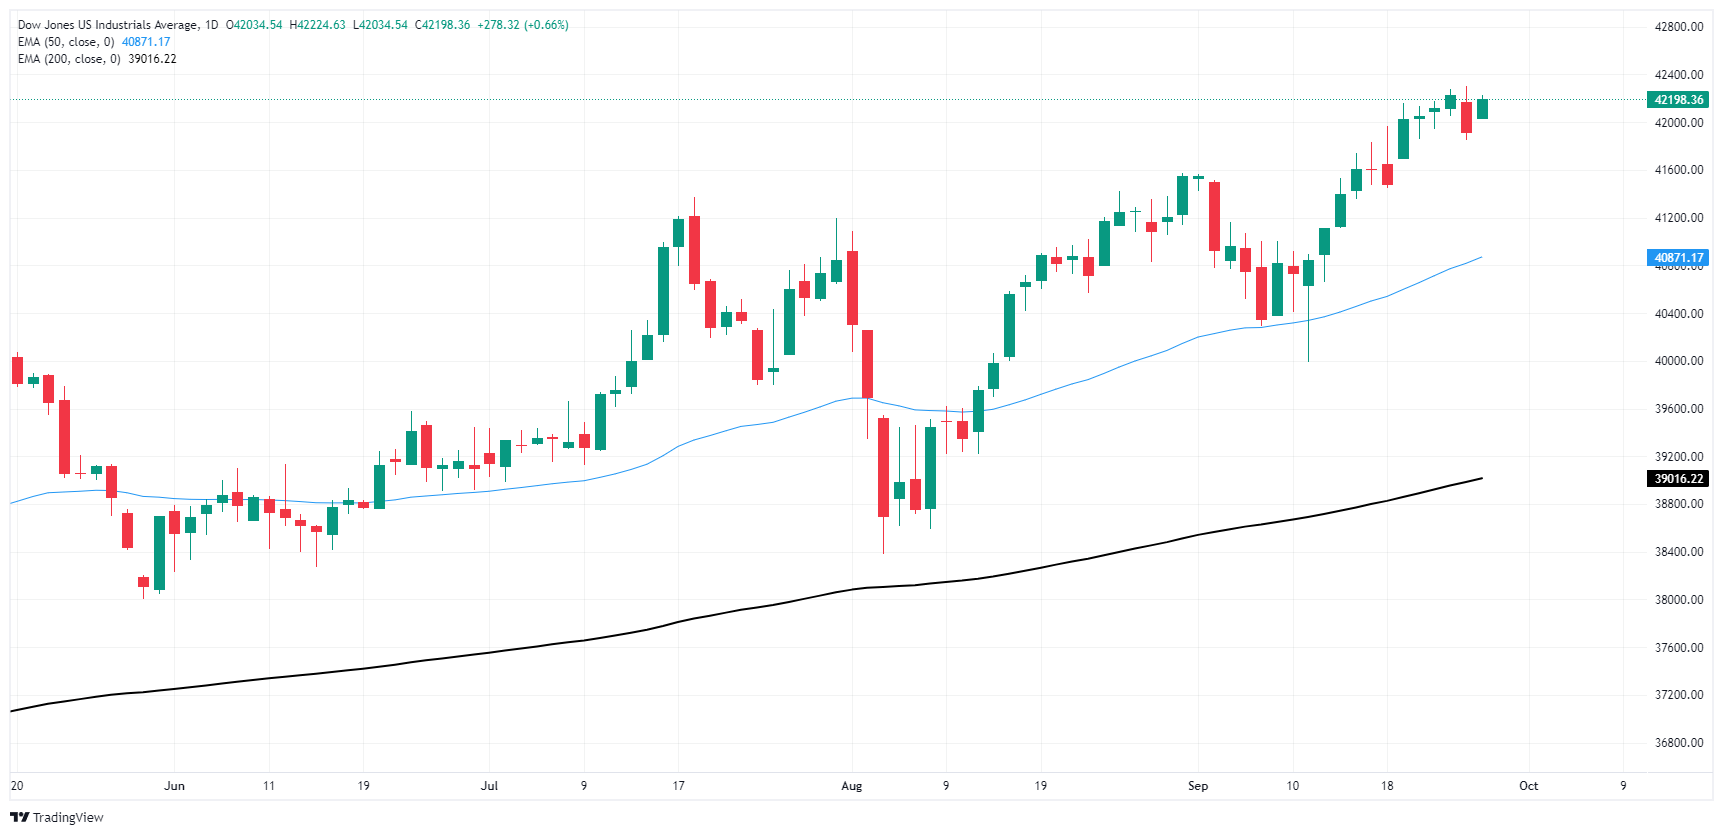
Dow Jones FAQs
The Dow Jones Industrial Average, one of the oldest stock market indices in the world, is compiled of the 30 most traded stocks in the US. The index is price-weighted rather than weighted by capitalization. It is calculated by summing the prices of the constituent stocks and dividing them by a factor, currently 0.152. The index was founded by Charles Dow, who also founded the Wall Street Journal. In later years it has been criticized for not being broadly representative enough because it only tracks 30 conglomerates, unlike broader indices such as the S&P 500.
Many different factors drive the Dow Jones Industrial Average (DJIA). The aggregate performance of the component companies revealed in quarterly company earnings reports is the main one. US and global macroeconomic data also contributes as it impacts on investor sentiment. The level of interest rates, set by the Federal Reserve (Fed), also influences the DJIA as it affects the cost of credit, on which many corporations are heavily reliant. Therefore, inflation can be a major driver as well as other metrics which impact the Fed decisions.
Dow Theory is a method for identifying the primary trend of the stock market developed by Charles Dow. A key step is to compare the direction of the Dow Jones Industrial Average (DJIA) and the Dow Jones Transportation Average (DJTA) and only follow trends where both are moving in the same direction. Volume is a confirmatory criteria. The theory uses elements of peak and trough analysis. Dow’s theory posits three trend phases: accumulation, when smart money starts buying or selling; public participation, when the wider public joins in; and distribution, when the smart money exits.
There are a number of ways to trade the DJIA. One is to use ETFs which allow investors to trade the DJIA as a single security, rather than having to buy shares in all 30 constituent companies. A leading example is the SPDR Dow Jones Industrial Average ETF (DIA). DJIA futures contracts enable traders to speculate on the future value of the index and Options provide the right, but not the obligation, to buy or sell the index at a predetermined price in the future. Mutual funds enable investors to buy a share of a diversified portfolio of DJIA stocks thus providing exposure to the overall index.
Author

Joshua Gibson
FXStreet
Joshua joins the FXStreet team as an Economics and Finance double major from Vancouver Island University with twelve years' experience as an independent trader focusing on technical analysis.


