Dow Jones Industrial Average churns after cooling US CPI inflation sparks pullback in tech stocks
- Dow Jones stuck to Thursday’s opening range after CPI inflation cools.
- Rate cut expectations pinned to the ceiling as price pressures ease.
- Market-wide pivot out of tech stocks limits gains from rate cut hopes.

The Dow Jones Industrial Average (DJIA) mostly stuck to familiar territory on Thursday, clipping into the high end after US Consumer Price Index (CPI) inflation came in below expectations and sparking an uptick in broad-market rate cut expectations in 2024. Despite easing inflation, a pivot out of tech stocks has kept equity indexes pinned close to flat during Thursday’s American market session.
June’s US CPI inflation broadly fell below forecasts, with annualized headline CPI inflation easing to 3.0% YoY from the previous 3.3% and falling even lower than the forecast 3.1%. CPI inflation actually contracted -0.1% MoM in June, falling back from the previous month’s flat 0.0% and below the forecast 0.1%.
US Initial Jobless Claims fell to 222K for the week ended July 5, down from the previous week’s revised 239K and improving from the forecast 236K. Thursday’s Initial Jobless Claims figure helped to push the four-week average down to 233.5K from the previous 238.75K.
With US CPI inflation cooling at an accelerated pace, market expectations for a rate hike from the Federal Reserve (Fed) are pricing in the possibility of three quarter-point rate cuts in 2024. According to the CME’s FedWatch Tool, rate market bets of a September rate cut have soared to 95%.
Dow Jones news
The Dow Jones looked for gains on Thursday, but topside momentum remained crimped as tech stocks declined, and concentrated losses in familiar technology names kept a lid on gains. Home Depot Inc. (HD) rose around 2.8% on Thursday, rising to $353.79 per share.
Intel Corp. ended Thursday down nearly 4%, falling to $33.50 per share while Microsoft Inc. (MSFT) tumbled around 2.5%, falling to $454.70 per share.
Dow Jones technical outlook
Dow Jones found slim gains on Thursday, but momentum remains stilted as the index tests the water of a supply zone priced in near the 40,000.00 major price handle. The Dow Jones has been slowly battling back into reach of all-time high bids sets just north of 40,000.00 back in May, recovering nearly 5% from the post-peak swing low towards 38,000.00.
Dow Jones five minute chart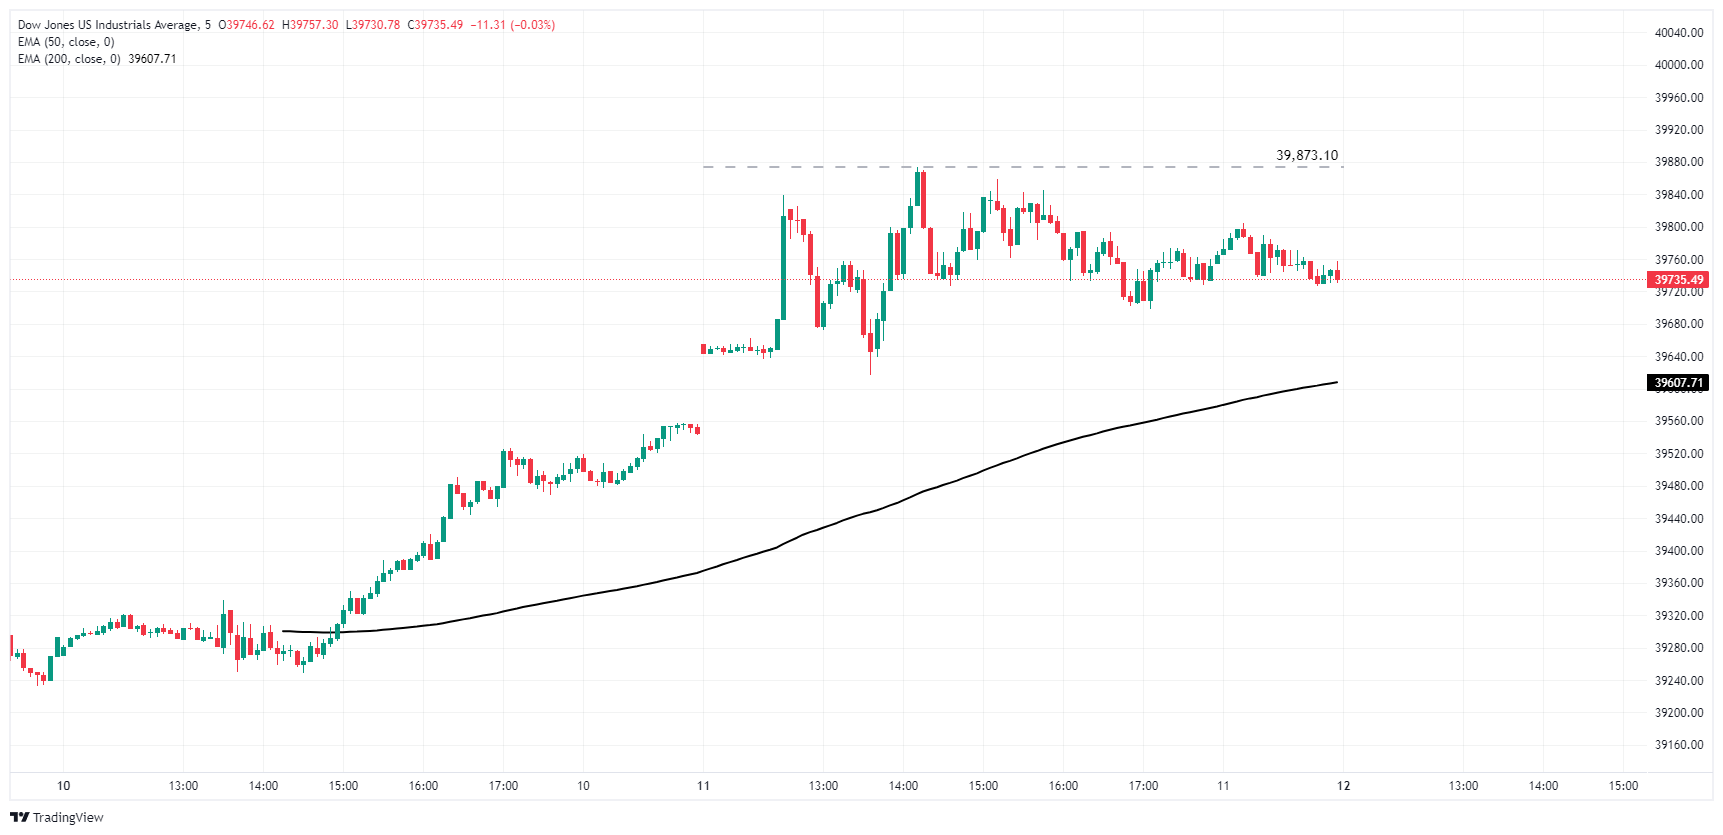
Dow Jones daily chart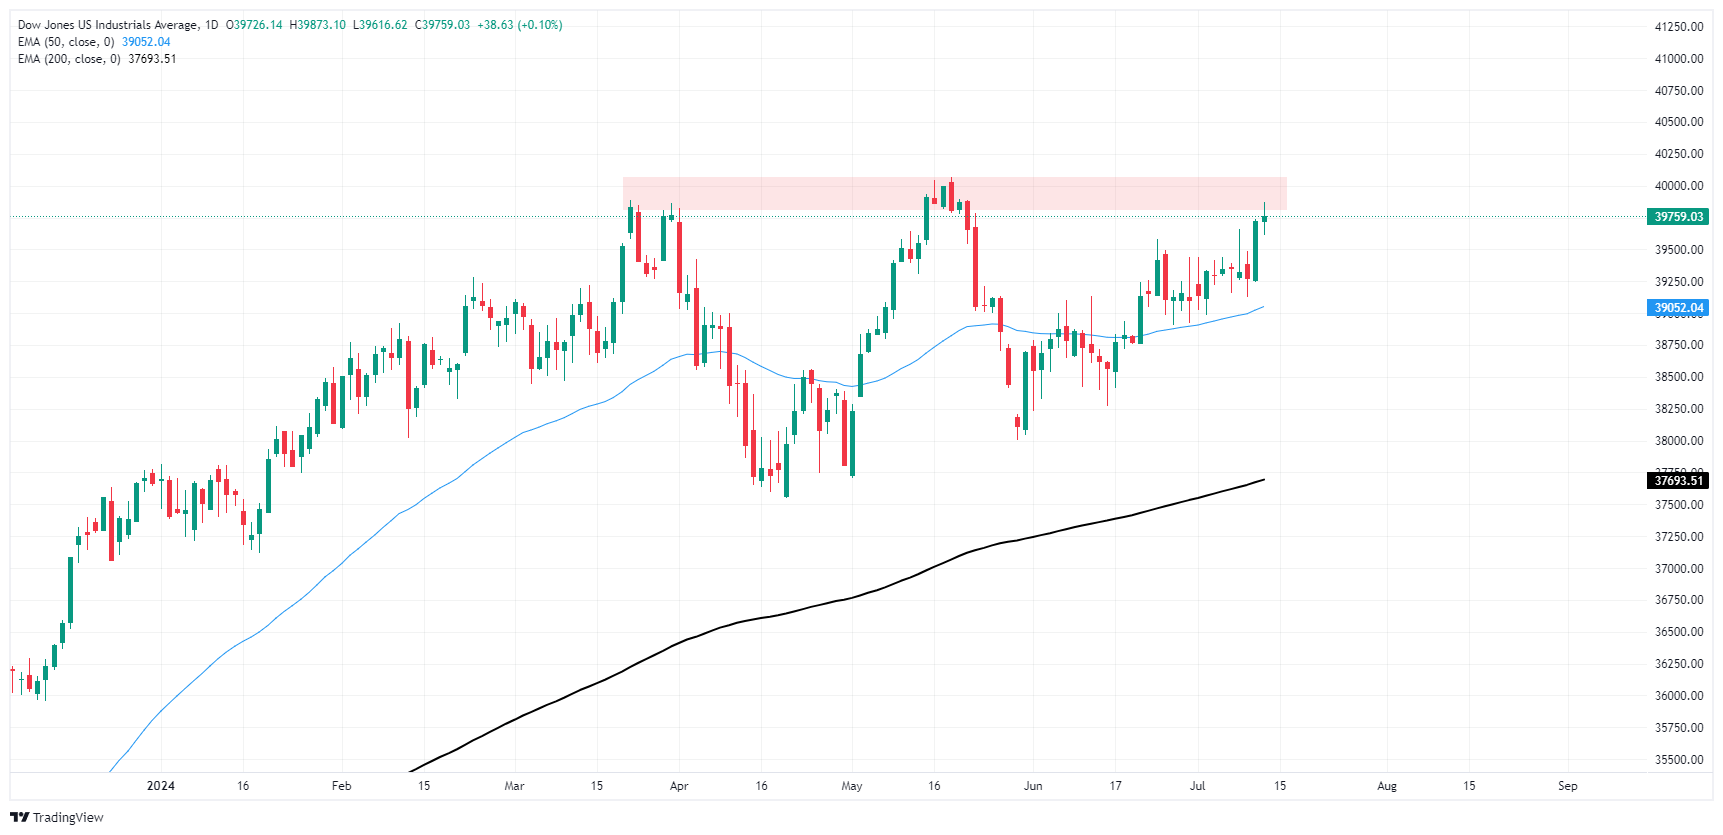
Dow Jones FAQs
The Dow Jones Industrial Average, one of the oldest stock market indices in the world, is compiled of the 30 most traded stocks in the US. The index is price-weighted rather than weighted by capitalization. It is calculated by summing the prices of the constituent stocks and dividing them by a factor, currently 0.152. The index was founded by Charles Dow, who also founded the Wall Street Journal. In later years it has been criticized for not being broadly representative enough because it only tracks 30 conglomerates, unlike broader indices such as the S&P 500.
Many different factors drive the Dow Jones Industrial Average (DJIA). The aggregate performance of the component companies revealed in quarterly company earnings reports is the main one. US and global macroeconomic data also contributes as it impacts on investor sentiment. The level of interest rates, set by the Federal Reserve (Fed), also influences the DJIA as it affects the cost of credit, on which many corporations are heavily reliant. Therefore, inflation can be a major driver as well as other metrics which impact the Fed decisions.
Dow Theory is a method for identifying the primary trend of the stock market developed by Charles Dow. A key step is to compare the direction of the Dow Jones Industrial Average (DJIA) and the Dow Jones Transportation Average (DJTA) and only follow trends where both are moving in the same direction. Volume is a confirmatory criteria. The theory uses elements of peak and trough analysis. Dow’s theory posits three trend phases: accumulation, when smart money starts buying or selling; public participation, when the wider public joins in; and distribution, when the smart money exits.
There are a number of ways to trade the DJIA. One is to use ETFs which allow investors to trade the DJIA as a single security, rather than having to buy shares in all 30 constituent companies. A leading example is the SPDR Dow Jones Industrial Average ETF (DIA). DJIA futures contracts enable traders to speculate on the future value of the index and Options provide the right, but not the obligation, to buy or sell the index at a predetermined price in the future. Mutual funds enable investors to buy a share of a diversified portfolio of DJIA stocks thus providing exposure to the overall index.
Author

Joshua Gibson
FXStreet
Joshua joins the FXStreet team as an Economics and Finance double major from Vancouver Island University with twelve years' experience as an independent trader focusing on technical analysis.


