Dow Jones Industrial Average reclaims 550 points on Thursday
- The Dow Jones climbed over 500 points on Thursday after upbeat US data print.
- US Retail Sales surged to 18-month high in July.
- Upbeat US data sloughs off recession fears, but tempers rate cut bets.

The Dow Jones Industrial Average (DJIA) gained north of 500 points on Thursday, climbing around 1.3% on the day as equities tipped into the bullish side after US Retail Sales surged well above forecasts. Markets are shedding recent fears of a recession in the US economy, bolstering risk appetite and sending indexes broadly higher.
However, not all is rosy in financial markets post-Retail Sales. According to the CME’s FedWatch Tool, rate markets are now pricing in just 25% odds of a 50 bps double cut from the Federal Reserve (Fed) in September, down significantly from last week’s peak bets of 70% odds. Rate traders have still fully priced in a September rate trim as a done deal, with 75% odds of at least 25 basis points off of the top on September 18.
Dow Jones news
The Dow Jones is broadly higher on Thursday, with all but four of the index’s listed securities testing into the green for the day. Only four stocks on the board are seeing red, with losses being led by Verizon Communications Inc. (VZ) which fell -1.87% to $40.13 per share.
The DJIA is getting dragged higher by firm gains from key listed companies, including Cisco Systems Inc. (CSCO) and Walmart Inc. (WMT). Cisco Systems is extending into a second day of gains after a solid earnings beat this week, rising 7.1% on Thursday to $48.67 per share. Walmart is seeing an earnings beat of its own on Thursday, climbing 6.5% to $73.14 per share after broadly beating growth forecasts.
Read more:
Walmart earnings and guidance impress, helping lead Dow Jones higher
Cisco earnings surprise Wall Street with fiscal Q4 earnings beat
Dow Jones price forecast
Thursday’s upswing puts the Dow Jones to close in the green for a third straight day, climbing even higher above the 40,000.00 handle after a recent plunge into near-term leans below 38,500.00. Price action is trading north of the 50-day Exponential Moving Average (EMA) as bulls return to the fold in force, and bidding continues to drive prices back towards all-time highs above 41,250.00 set in July.
Dow Jones daily chart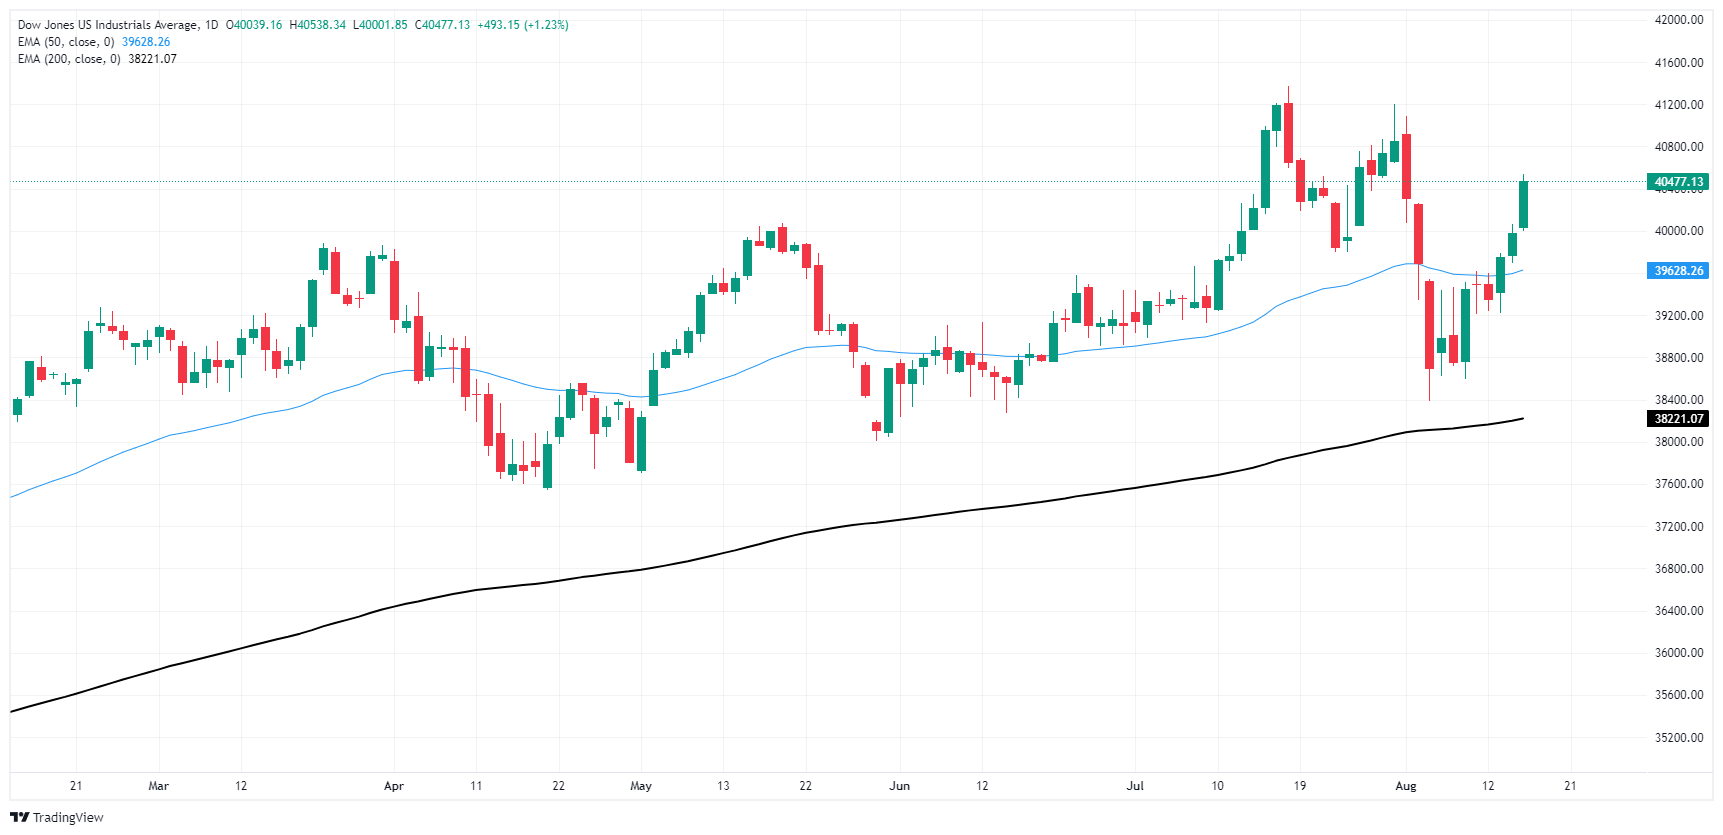
Dow Jones FAQs
The Dow Jones Industrial Average, one of the oldest stock market indices in the world, is compiled of the 30 most traded stocks in the US. The index is price-weighted rather than weighted by capitalization. It is calculated by summing the prices of the constituent stocks and dividing them by a factor, currently 0.152. The index was founded by Charles Dow, who also founded the Wall Street Journal. In later years it has been criticized for not being broadly representative enough because it only tracks 30 conglomerates, unlike broader indices such as the S&P 500.
Many different factors drive the Dow Jones Industrial Average (DJIA). The aggregate performance of the component companies revealed in quarterly company earnings reports is the main one. US and global macroeconomic data also contributes as it impacts on investor sentiment. The level of interest rates, set by the Federal Reserve (Fed), also influences the DJIA as it affects the cost of credit, on which many corporations are heavily reliant. Therefore, inflation can be a major driver as well as other metrics which impact the Fed decisions.
Dow Theory is a method for identifying the primary trend of the stock market developed by Charles Dow. A key step is to compare the direction of the Dow Jones Industrial Average (DJIA) and the Dow Jones Transportation Average (DJTA) and only follow trends where both are moving in the same direction. Volume is a confirmatory criteria. The theory uses elements of peak and trough analysis. Dow’s theory posits three trend phases: accumulation, when smart money starts buying or selling; public participation, when the wider public joins in; and distribution, when the smart money exits.
There are a number of ways to trade the DJIA. One is to use ETFs which allow investors to trade the DJIA as a single security, rather than having to buy shares in all 30 constituent companies. A leading example is the SPDR Dow Jones Industrial Average ETF (DIA). DJIA futures contracts enable traders to speculate on the future value of the index and Options provide the right, but not the obligation, to buy or sell the index at a predetermined price in the future. Mutual funds enable investors to buy a share of a diversified portfolio of DJIA stocks thus providing exposure to the overall index.
Author

Joshua Gibson
FXStreet
Joshua joins the FXStreet team as an Economics and Finance double major from Vancouver Island University with twelve years' experience as an independent trader focusing on technical analysis.


