Dow Jones Industrial Average Forecast: DJIA runs lower on hawkish Fed
- The Dow Jones Industrial Index falls on Thursday but outperforms NASDAQ, S&P 500.
- Federal Reserve dot plot raises interest rate forecasts for 2024, 2025.
- Cisco attempts to buy Splunk for $28 billion.
- Powell says majority of Fed governors favor another hike in 2023.
- Initial Jobless Claims of 201K came in well below consensus.

The Dow Jones Industrial Average (DJIA) is down over 1.00% on Thursday, at the time of writing, as the entire equity market recedes for a second day. The decline comes after the Federal Reserve meeting, on Wednesday, when the US central bank once again paused interest rates but raised the specter of another hike before year end.
Dow component Cisco (CSCO) announced plans to buy Splunk (SPLK) for $28 billion. The deal values Splunk at a 32% premium to Wednesday’s closing price. On the other hand, Cisco’s share price fell nearly 5% on the news.
The more value-oriented Dow has so far been outperforming its index cousins this week. The NASDAQ Composite and S&P 500 have both fallen by more than 1% on Thursday.
Dow Jones News: Fed delivers most hawkish pause possible
As predicted far and wide, the Federal Reserve left interest rates parked in the range of 5.25% to 5.5%. The Dow Jones advanced in the lead up to Wednesday’s Federal Open Market Committee presser, but the entire market caved once it saw the Fed’s dot plot.
The dot plot is just the colloquial term for the Summary of Economic Projections (SEP) report that shows individual Fed governors’ forecasts for interest rates in the future. A big surprise was that about two-thirds of voting governors think the bank will raise rates again before the year is out. In total, 12 governors estimated that 2023 ends 25 basis points higher than the current range, while seven governors forecast rates staying put.
Still, the CME Group’s FedWatch Tool has only ticked up from 29% to a 31.5% chance that the central bank raises rates at the November 1 meeting. The forecast for a 25 bps hike at the December 31 meeting likewise has only risen by 2 percentage points to 39%.
The market seems less focused on 2023 rates and more worried that the Fed thinks rates will remain higher for longer. In the previous meeting, the dot plot showed consensus among governors for interest rates falling by 100 basis points by the end of 2024. The September version, however, showed a mere 50 basis point cut. What’s more, the new SEP has rates coming down more slowly in 2025 than earlier projections.
This new hawkish demeanor from the Fed’s Powell comes on the back of higher-than-expected Consumer Price Index (CPI) and Producer Price Index (PPI) data that showed an inflationary environment more stubborn than before.
Essentially, the equity market is in decline as institutional investors bail out of stocks for the greater certainty of Treasuries. The 2-year Treasury saw yields rise nearly 2% early Thursday to a level not seen in decades. If there is any silver lining, it is that the more growth-oriented NASDAQ is beginning to underperform the less interest rate-sensitive Dow Jones index.
Initial Jobless Claims arrive lower than consensus
The Initial Jobless Claims for the week ending September 15 were reported before market open on Thursday. The topline figure of 201K was well below consensus of 225K, as well as the previous week’s print of 221K. It seems the economy, and the labor market is doing better than economists expected.
Continuing Jobless Claims for the week ending September 8 also performed better than the average forecast. Continuing Jobless Claims printed at 1.662 million, lower than the previous report for 1.683 million.
After the market opens, data on US Existing Home Sales Change for August will be released. The consensus expects an improving picture after the previous month’s -2.2% print.
On Friday, the S&P Global PMIs for Manufacturing and Services will be released. Both are expected to improve by 10 basis points to 48 and 50.6, respectively.
Dow Jones FAQs
What is the Dow Jones?
The Dow Jones Industrial Average, one of the oldest stock market indices in the world, is compiled of the 30 most traded stocks in the US. The index is price-weighted rather than weighted by capitalization. It is calculated by summing the prices of the constituent stocks and dividing them by a factor, currently 0.152. The index was founded by Charles Dow, who also founded the Wall Street Journal. In later years it has been criticized for not being broadly representative enough because it only tracks 30 conglomerates, unlike broader indices such as the S&P 500.
What factors impact the Dow Jones Industrial Average?
Many different factors drive the Dow Jones Industrial Average (DJIA). The aggregate performance of the component companies revealed in quarterly company earnings reports is the main one. US and global macroeconomic data also contributes as it impacts on investor sentiment. The level of interest rates, set by the Federal Reserve (Fed), also influences the DJIA as it affects the cost of credit, on which many corporations are heavily reliant. Therefore, inflation can be a major driver as well as other metrics which impact the Fed decisions.
What is Dow Theory?
Dow Theory is a method for identifying the primary trend of the stock market developed by Charles Dow. A key step is to compare the direction of the Dow Jones Industrial Average (DJIA) and the Dow Jones Transportation Average (DJTA) and only follow trends where both are moving in the same direction. Volume is a confirmatory criteria. The theory uses elements of peak and trough analysis. Dow’s theory posits three trend phases: accumulation, when smart money starts buying or selling; public participation, when the wider public joins in; and distribution, when the smart money exits.
How can I trade the DJIA?
There are a number of ways to trade the DJIA. One is to use ETFs which allow investors to trade the DJIA as a single security, rather than having to buy shares in all 30 constituent companies. A leading example is the SPDR Dow Jones Industrial Average ETF (DIA). DJIA futures contracts enable traders to speculate on the future value of the index and Options provide the right, but not the obligation, to buy or sell the index at a predetermined price in the future. Mutual funds enable investors to buy a share of a diversified portfolio of DJIA stocks thus providing exposure to the overall index.
Dow Jones Industrial Average forecast
The Dow Jones appears to be in pullback mode. The index has not reached a new high since August 1, nearly two months ago. The futures market shows the Dow crossing below the 32,291 low from September 6. With the DJIA now plumbing the line near 34,250, the next stop may be the August 25 low at 34,029. A true downtrend will need to break to a lower low below that 34,029 level, however. That is why 33,700 seems like a solid bet at the moment.

Dow Jones Industrial Average daily chart
It does appear that investors should have foreseen the current pullback. Dow Theory tells us that we should watch out for periods where the Dow Jones Industrial Average pulls away from the Dow Transport Index (DJT), and that is exactly what took place mid-summer. In the chart below, the DJT advanced well above the DJIA, which it normally travels with in near lock-step.
Dow Theory says that when this relationship gets out of whack, a reversal in trend is likely to come next. Sure enough, that seems to be taking place right in front of use.
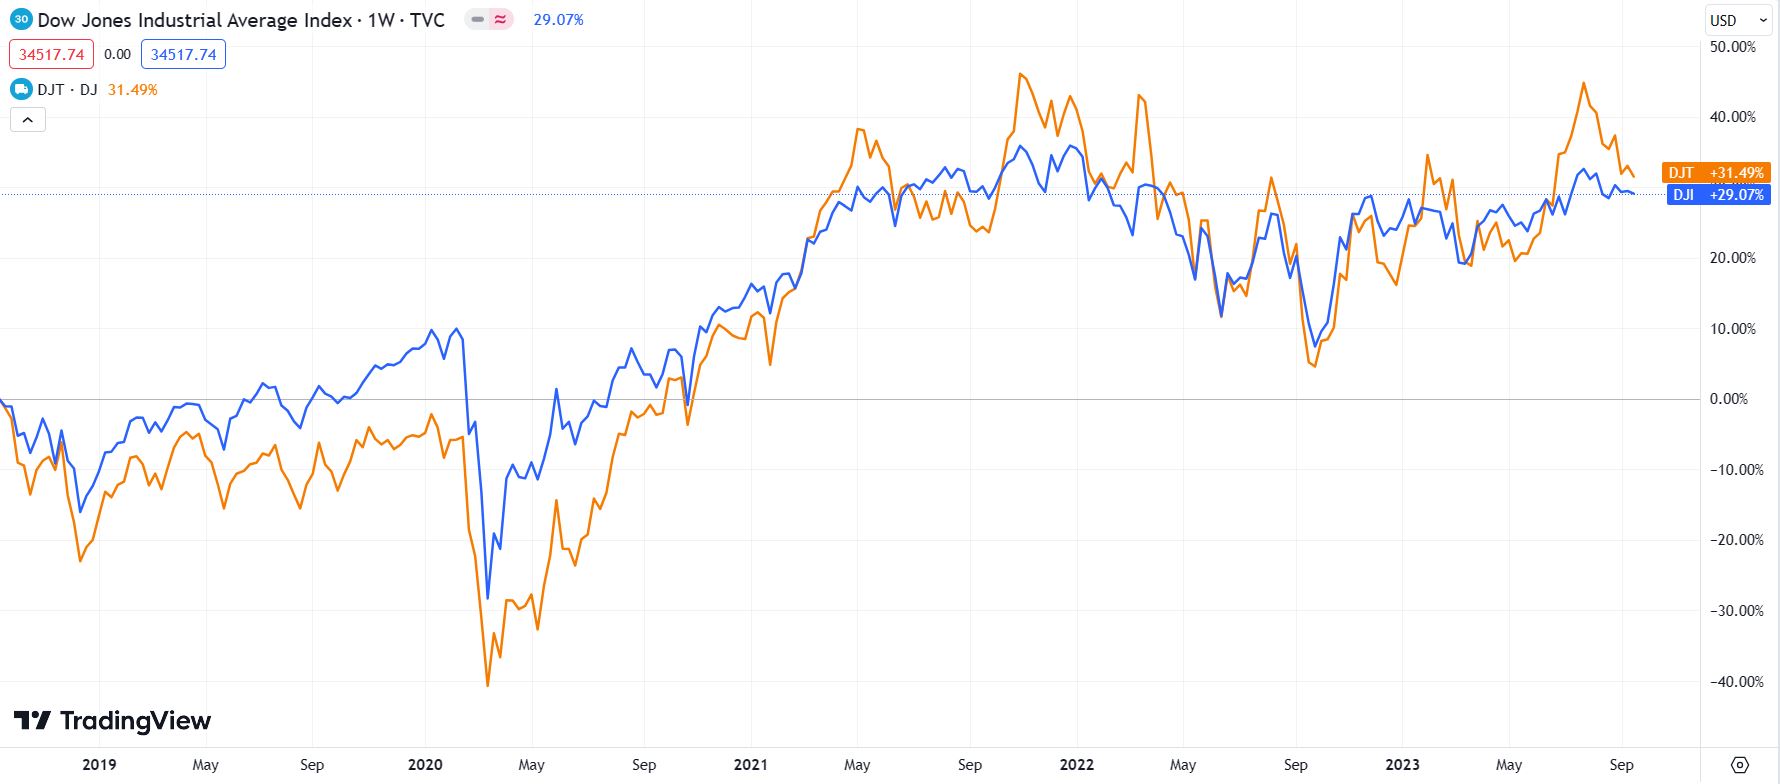
DJT/DJIA 5-year chart
Author

Clay Webster
FXStreet
Clay Webster grew up in the US outside Buffalo, New York and Lancaster, Pennsylvania. He began investing after college following the 2008 financial crisis.


