Dow Jones Industrial Average Forecast: DJIA closes up despite Thursday sell-off caused by higher CPI
- Dow Jones Industrial Index opened lower on Thursday as December US CPI print arrived above consensus.
- Core inflation for December fell, but headline annual CPI accelerated to 3.4%.
- DJIA rests just below its all-time high of 37,790 despite Thursday's pullback.
- UnitedHealth Group, the Dow’s largest holding, reports earnings before the open on Friday.
The Dow Jones Industrial Average (DJIA) recovered by the close on Thursday after a sell-off in the morning session that was induced by a sticky inflation reading. The US Consumer Price Index (CPI) release for December showed headline inflation drifting higher than expected.
The Dow Jones index closed up 0.04%, while the NASDAQ Composite and S&P 500 closed flat and down, respectively.
More significant for the Dow Jones index, however, will be Friday’s earnings release for UnitedHealth Group (UNH). UNH stock is the largest of its 30 holdings, so any major volatility associated with the fourth-quarter figures has the power to bend the entire index in its direction.
Dow Jones News: Headline inflation in CPI comes in hot
The consensus among economists heading into Thursday’s December CPI print was already calling for annual headline inflation to rise and for annual core inflation to drop. That is what took place in the data overall, but inflation appeared more sticky than projected.
Annual headline inflation in December arrived at 3.4%. This was much higher than the 3.1% reading for November or the December consensus of 3.2%. The report largely blamed housing costs, which amounted to about half of the increase in inflation.
Annual core inflation did fall in December but by less than expected. December’s core CPI was 3.9%, below the 4% print in November but above the expected 3.8% consensus.
On a monthly basis, inflation rose 0.3% from November for both headline and core readings.
"This print is aligned with our view that disinflation ahead will be gradual," wrote Morgan Stanley chief US economist Ellen Zentner in a client note.
The problem for markets is that stickier inflation may force the Federal Reserve to become more careful about cutting interest rates. The Fed dot plot in December showed that central bank officials expected three interest rate cuts in 2024 at 25 basis points apiece.
Interestingly, the CME Group’s FedWatch Tool shows that bets on a March 25-basis-point rate cut actually rose Thursday morning by two percentage points to 67%, though predictions for a cut of 50 basis points fell by one percentage point. Likewise, the odds grew for a further 25-basis-point cut at the Fed’s May meeting, while the odds for a larger cut disintegrated.
Dow Jones News: UnitedHealth reports Q4 results before Friday open
As the United States’ largest health insurer, UnitedHealth Group has been a steady compounder for decades and now represents the largest holding in the Dow Jones index at nearly 9.5%. This means that the volatility normally associated with earnings releases is large enough to take the whole index with it.
UnitedHealth has not missed Wall Street’s quarterly consensus on either the top line or bottom line since the second quarter of 2020, so the odds favor yet another beat early Friday. Current estimates place the fourth quarter’s consensus at $5.98 in adjusted earnings per share (EPS) on revenue of $92.16 billion.
Of the 18 analysts to issue earnings revisions in the runup to the fourth-quarter unveiling, 16 of them revised their estimates lower. This is largely a product of an overwhelming rise in healthcare costs in 2023. CVS Health (CVS), which owns Aetna, warned investors on Monday that healthcare costs were pinching margins, although it doesn’t report quarterly earnings until early February.
"We've continued to see pressure [within our healthcare benefits segment],” said newly appointed CFO Tom Cowhey at a healthcare conference in San Francisco sponsored by JPMorgan. Cowhey said that CVS would likely exceed the 86% guidance it had given for its medical costs as a proportion of its healthcare premiums.
Additionally, JPMorgan (JPM) will also report quarterly results on Friday. The nation’s largest bank makes up about 3% of the Dow Jones index and is its fifteenth-largest holding.
S&P 500 FAQs
What is the S&P 500?
The S&P 500 is a widely followed stock price index which measures the performance of 500 publicly owned companies, and is seen as a broad measure of the US stock market. Each company’s influence on the computation of the index is weighted based on market capitalization. This is calculated by multiplying the number of publicly traded shares of the company by the share price. The S&P 500 index has achieved impressive returns – $1.00 invested in 1970 would have yielded a return of almost $192.00 in 2022. The average annual return since its inception in 1957 has been 11.9%.
How are companies chosen to be included in the S&P 500?
Companies are selected by committee, unlike some other indexes where they are included based on set rules. Still, they must meet certain eligibility criteria, the most important of which is market capitalization, which must be greater than or equal to $12.7 billion. Other criteria include liquidity, domicile, public float, sector, financial viability, length of time publicly traded, and representation of the industries in the economy of the United States. The nine largest companies in the index account for 27.8% of the market capitalization of the index.
How can I trade the S&P 500?
There are a number of ways to trade the S&P 500. Most retail brokers and spread betting platforms allow traders to use Contracts for Difference (CFD) to place bets on the direction of the price. In addition, that can buy into Index, Mutual and Exchange Traded Funds (ETF) that track the price of the S&P 500. The most liquid of the ETFs is State Street Corporation’s SPY. The Chicago Mercantile Exchange (CME) offers futures contracts in the index and the Chicago Board of Options (CMOE) offers options as well as ETFs, inverse ETFs and leveraged ETFs.
What factors drive the S&P 500?
Many different factors drive the S&P 500 but mainly it is the aggregate performance of the component companies revealed in their quarterly and annual company earnings reports. US and global macroeconomic data also contributes as it impacts on investor sentiment, which if positive drives gains. The level of interest rates, set by the Federal Reserve (Fed), also influences the S&P 500 as it affects the cost of credit, on which many corporations are heavily reliant. Therefore, inflation can be a major driver as well as other metrics which impact the Fed decisions.
Dow Jones Industrial Average forecast: DJIA still near all-time high
The Dow Jones index has been cresting since the end of 2023, largely moving sideways after marking a new all-time high at 37,790 on January 2, 2024. The hotter inflation print on Thursday pushed the index down to test the 21-day Simple Moving Average (SMA), but the DJIA was able to bounce back higher off that plunge.
A break of the 21-day SMA should send the DJIA back to the 36,500 to 36,952 former resistance zone that stems from highs formed in January of 2022. If the area turns into an area of support, the DJIA could recoup there before its next leg higher. Both the Relative Strength Index (RSI) and the Moving Average Convergence Divergence (MACD) indicator show that further downside is likely to come.
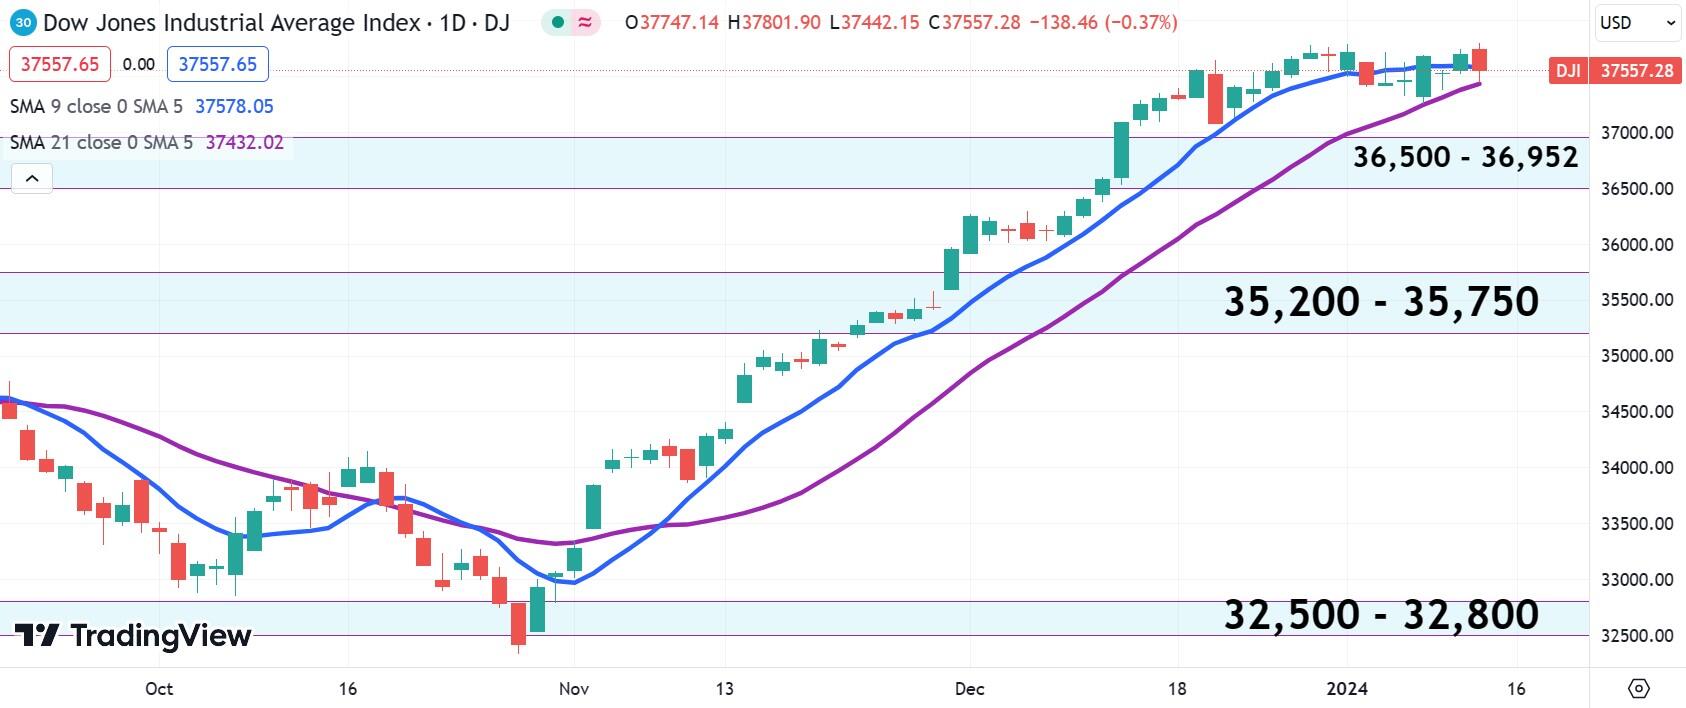
Dow Jones Industrial Average daily chart
Premium
You have reached your limit of 3 free articles for this month.
Start your subscription and get access to all our original articles.
Author

Clay Webster
FXStreet
Clay Webster grew up in the US outside Buffalo, New York and Lancaster, Pennsylvania. He began investing after college following the 2008 financial crisis.


