Dow Jones Industrial Average Forecast: DJIA rises for fourth straight day, but Cisco crashes 10%
- Dow Jones Industrial Index benefits with the rest of the market from lower inflation readings.
- Producer Price Index for October fell half a percentage point on a monthly basis.
- Retails Sales for October declined slightly from the previous month.
- Following a positive earnings result from The Home Depot, Dow investors wait on Cisco, Walmart results.

The Dow Jones Industrial Average (DJIA) rose 0.47% on Wednesday for its fourth consecutive gaining session on Wednesday. However, Cisco Systems (CSCO) crashed more than 10% after reducing its full-year outlook for both earnings and sales.
The market was optimistic during Wednesday's regular session following the October releases from the Producer Price Index (PPI) and US Retail Sales. Both economic indicators added to Tuesday’s belief that the economy is steadily melting down into the much-heralded “soft landing” scenario in which inflation subsides without a harsh effect on consumer spending or employment.
The DJIA has advanced about 2% this week through Wednesday, and the index has gained about 0.4% on Wednesday itself. The S&P 500 and NASDAQ Composite advanced healthily during the session but were barely postive by the closing bell.
The US House of Representatives passed a bipartisan stop-gap measure that will continue funding the Federal government at present levels for a few more months, and this political event has removed yet another worry spot for the markets through the end of the year.
The Home Depot (HD) reported a positive quarter earlier this week, so the fundamentals of the DJIA seem to be on better footing. Walmart (WMT) earnings should direct the index on Thursday.
Dow Jones News: With inflation receding, the Fed may cut rates sooner than expected
Although Monday saw gains continue from the prior week, Tuesday’s Consumer Price Index (CPI) release for October was the initial starting gun for this week’s rally. Headline CPI showed inflation was flat between September and October, which beat economists’ prediction and was much lower than the September print.
The DJIA closed up more than 1.4% on Tuesday due to this indicator alone as trader’s pulled forward their expectation for next year’s Federal Reserve rate cutting target to earlier on the calendar. Traders now give a 26% chance that the central bank begins cutting interest rates in March, according to the CME FedWatch Tool. For the May meeting, a majority (58%) of the market expects the fed funds rate to be either 25 or 50 basis points below the current 5.25% to 5.5% range.
Tuesday’s CPI reading was lent even more credibility on Wednesday, when the PPI scaled back by half a percentage point in October. The PPI shows production prices in the US economy, and lower energy prices contributed to a pullback in manufacturing costs this time around.
On Wednesday, US Retail Sales for October dipped 0.1% on a monthly basis rather than the 0.3% that was consensus. This reading ushers in further proof that the economy may be cooling off in light of high interest rates but is not in danger of a severe downturn. The soft landing was once laughed at but is now the state religion on Wall Street.
Home Depot signals positive signs for Cisco, Walmart
The Home Depot is one of America’s premier retailers for the construction and home renovation sphere. As such, it becomes a proxy for how the US consumer is doing. Tuesday’s Q3 results were a parable for the US economy experiencing the so-called soft landing thesis.
The Home Depot bested Wall Street consensus on the top and bottom lines despite lots of negatives among the details. Consumers are choosing smaller home renovation projects as average customer ticket spending fell from a year ago. Comparable sales also fell 3.5% YoY.
However, The Home Depot is not experiencing a major pullback in revenue but more of a lull in action. Nothing in the results shows that US consumers are all that pressured, and management said that revenue in the current fiscal year would decline just 3% or 4%.
The Home Depot rallied on the earnings results, which sets things up nicely for another Dow component – Walmart.
Walmart is a major retailer like The Home Depot, just in a different category. On the back of Wednesday’s Target (TGT) earnings hoopla – TGT stock rallied 17% – prospects for Walmart are also looking up. The company is expected to grow revenue about $7 billion from a year ago and increase per share earnings marginally.
S&P 500 FAQs
What is the S&P 500?
The S&P 500 is a widely followed stock price index which measures the performance of 500 publicly owned companies, and is seen as a broad measure of the US stock market. Each company’s influence on the computation of the index is weighted based on market capitalization. This is calculated by multiplying the number of publicly traded shares of the company by the share price. The S&P 500 index has achieved impressive returns – $1.00 invested in 1970 would have yielded a return of almost $192.00 in 2022. The average annual return since its inception in 1957 has been 11.9%.
How are companies chosen to be included in the S&P 500?
Companies are selected by committee, unlike some other indexes where they are included based on set rules. Still, they must meet certain eligibility criteria, the most important of which is market capitalization, which must be greater than or equal to $12.7 billion. Other criteria include liquidity, domicile, public float, sector, financial viability, length of time publicly traded, and representation of the industries in the economy of the United States. The nine largest companies in the index account for 27.8% of the market capitalization of the index.
How can I trade the S&P 500?
There are a number of ways to trade the S&P 500. Most retail brokers and spread betting platforms allow traders to use Contracts for Difference (CFD) to place bets on the direction of the price. In addition, that can buy into Index, Mutual and Exchange Traded Funds (ETF) that track the price of the S&P 500. The most liquid of the ETFs is State Street Corporation’s SPY. The Chicago Mercantile Exchange (CME) offers futures contracts in the index and the Chicago Board of Options (CMOE) offers options as well as ETFs, inverse ETFs and leveraged ETFs.
What factors drive the S&P 500?
Many different factors drive the S&P 500 but mainly it is the aggregate performance of the component companies revealed in their quarterly and annual company earnings reports. US and global macroeconomic data also contributes as it impacts on investor sentiment, which if positive drives gains. The level of interest rates, set by the Federal Reserve (Fed), also influences the S&P 500 as it affects the cost of credit, on which many corporations are heavily reliant. Therefore, inflation can be a major driver as well as other metrics which impact the Fed decisions.
What they said about the market – David Kostin
Goldman Sachs equity strategist David Kostin says 2024 may not be a banner year for the stock market as the S&P 500 has already rallied 17% in 2023. In an investor note on Wednesday, Kostin said he expects the index to end 2024 just 5% higher than the current level at 4,700. Kostin says the market is pricing stocks correctly at the moment, owing to consensus around 2024 US GDP growing at 2.1%.
"Our macro forecasts imply a benign outcome for equities, but the current starting point will limit the potential appreciation for the benchmark US equity index in 2024."
Dow Jones Industrial Average forecast: Reason for optimism
Two weeks ago, the Dow Jones index broke out of its descending topline, and it hasn’t stopped since. The primary reason to trust in the current rally is that the DJIA basically gapped up through the 34,300 to 34,700 consolidation zone in just two sessions.
Now the DJIA is hovering just below the 35,000 resistance point. This level held bulls at bay back in late August and mid-December. A break here will give the market a free shot at the 2023 high of 35,679 from August 1. A pullback could push the index back to support near 34,700.
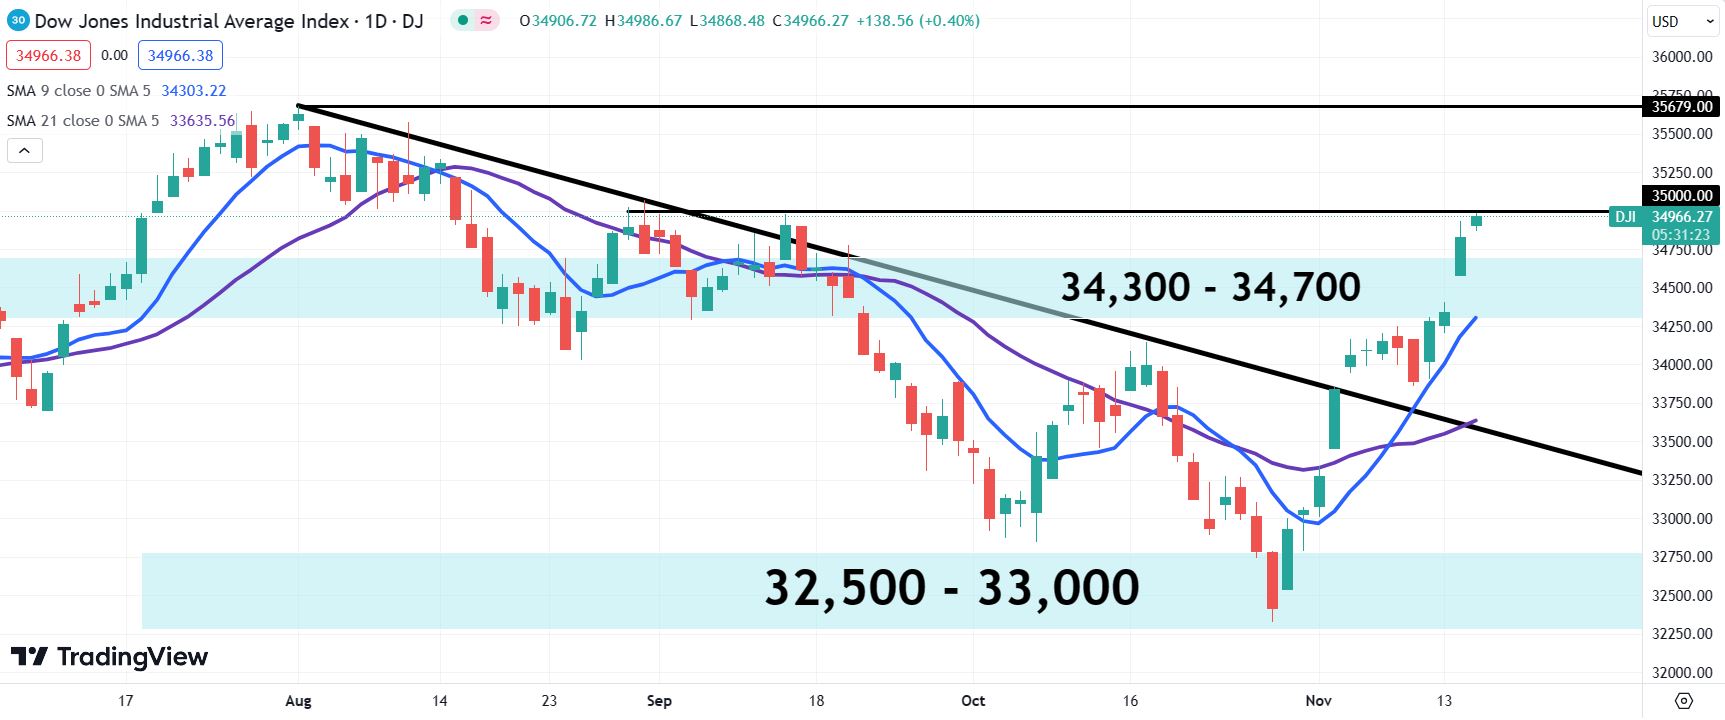
Dow Jones Industrial Average daily chart
Premium
You have reached your limit of 3 free articles for this month.
Start your subscription and get access to all our original articles.
Author

Clay Webster
FXStreet
Clay Webster grew up in the US outside Buffalo, New York and Lancaster, Pennsylvania. He began investing after college following the 2008 financial crisis.


