Dow Jones Industrial Average finds tepid chart action after Fed holds rates flat
- The Dow Jones was mostly flat on Wednesday as the Fed leans into a wait-and-see stance.
- Markets now expect the Fed to stand pat until June at the earliest.
- Despite the forecast of no rate moves, markets will be watching the FOMC closely.

On Wednesday, the Dow Jones Industrial Average (DJIA) remained steady, hovering around 44,700, shedding around 130 points but holding steady through the midweek market session. The major equity index is currently near its all-time highs above 45,000, but stock traders still have a bit of work to do to push bids back into those record peaks.
As many had expected, the Federal Reserve (Fed) decided to hold rates steady. Fed Chair Jerome Powell emphasized the Fed's commitment to a data-driven approach to future rate adjustments.
Chair Powell mentioned that the Federal Open Market Committee (FOMC) is carefully observing US President Donald Trump's policies; however, he clarified that the President has not directly contacted the Fed. As an independent federal institution, the White House's influence over the Fed's policy guidance is quite limited.
He also pointed out that although inflation is gradually moving toward the target levels, the current economic climate, along with certain concerns regarding President Trump's ambitious trade policies, means the Fed isn't in a hurry to modify the current restrictions on policy rates.
In the rate markets, expectations for Fed rate cuts in 2025 have been reduced. The CME's FedWatch Tool indicates that rate futures markets predict no changes to the Fed funds rate until at least June.
Dow Jones news
Most of the Dow Jones is holding in tepid territory ahead of the Fed’s latest rate call. The equity index is roughly split down the middle between losers and winners, though Nvidia (NVDA) is continuing its latest trend of falling to the bottom. Nvidia is down another 4.6% on Wednesday, falling below $123 per share as the chip-punching silicon merchant continues to take a pummeling as China’s open-source AI megamodel, DeepSeek, threatens US venture-capital-fueled AI infrastructure dominance.
Dow Jones price forecast
The Dow Jones Industrial Average is drying out just south of record highs above 45,000, with intraday price action testing the waters near 44,800. A topside break will see the Dow Jones chalking in fresh all-time peak bids, while a bearish turnaround will mark the major equity index’s first ‘lower high’ pattern since mid-2024.
Dow Jones daily chart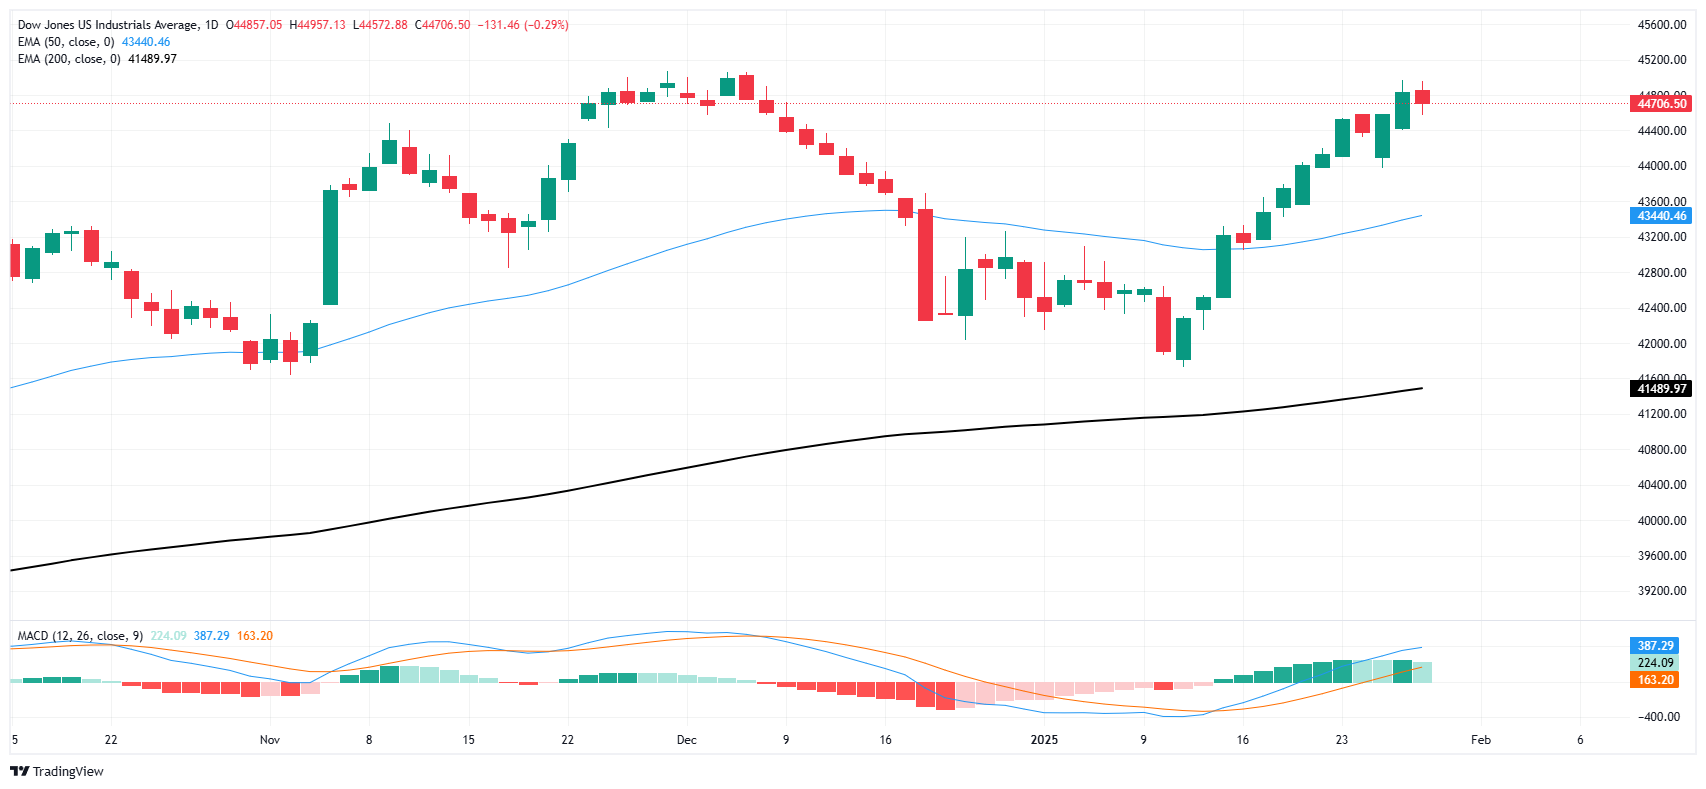
Dow Jones FAQs
The Dow Jones Industrial Average, one of the oldest stock market indices in the world, is compiled of the 30 most traded stocks in the US. The index is price-weighted rather than weighted by capitalization. It is calculated by summing the prices of the constituent stocks and dividing them by a factor, currently 0.152. The index was founded by Charles Dow, who also founded the Wall Street Journal. In later years it has been criticized for not being broadly representative enough because it only tracks 30 conglomerates, unlike broader indices such as the S&P 500.
Many different factors drive the Dow Jones Industrial Average (DJIA). The aggregate performance of the component companies revealed in quarterly company earnings reports is the main one. US and global macroeconomic data also contributes as it impacts on investor sentiment. The level of interest rates, set by the Federal Reserve (Fed), also influences the DJIA as it affects the cost of credit, on which many corporations are heavily reliant. Therefore, inflation can be a major driver as well as other metrics which impact the Fed decisions.
Dow Theory is a method for identifying the primary trend of the stock market developed by Charles Dow. A key step is to compare the direction of the Dow Jones Industrial Average (DJIA) and the Dow Jones Transportation Average (DJTA) and only follow trends where both are moving in the same direction. Volume is a confirmatory criteria. The theory uses elements of peak and trough analysis. Dow’s theory posits three trend phases: accumulation, when smart money starts buying or selling; public participation, when the wider public joins in; and distribution, when the smart money exits.
There are a number of ways to trade the DJIA. One is to use ETFs which allow investors to trade the DJIA as a single security, rather than having to buy shares in all 30 constituent companies. A leading example is the SPDR Dow Jones Industrial Average ETF (DIA). DJIA futures contracts enable traders to speculate on the future value of the index and Options provide the right, but not the obligation, to buy or sell the index at a predetermined price in the future. Mutual funds enable investors to buy a share of a diversified portfolio of DJIA stocks thus providing exposure to the overall index.
Author

Joshua Gibson
FXStreet
Joshua joins the FXStreet team as an Economics and Finance double major from Vancouver Island University with twelve years' experience as an independent trader focusing on technical analysis.


