Dow Jones Industrial Average plunges 1,000 points on risk-off Monday
- Dow Jones fell another 1,300 points from Friday’s close.
- Markets are recoiling amidst concerns of an escalation in Middle East conflicts.
- Souring US economic data is increasing concerns of a wider economic slowdown.

The Dow Jones Industrial Average (DJIA) extended into a third straight day of downside momentum as equities plunge in the face of a bad batch of US economic figures signalling the growing possibility of a harder, deeper recession than most investors were prepared for in the coming months. Geopolitical tensions are also on the rise, further batting down risk appetite as the Israel-Palestinian Hamas conflict looks set to widen with the possible involvement with Iran.
Last Friday’s US Nonfarm Payrolls (NFP) would have been a good print in years past, but that was then and this is now. The lowest initial print in the number of net jobs additions since 2019 sent shockwaves through investor markets, dragging down equities and sparking fears of a broad recession over the horizon for the US economy. Monday accelerated losses, sending all US sectors and indexes into the red.
The US S&P Global Services Purchasing Manager Index (PMI) for July eased to 55.0 from the expected hold at 56.0, and July’s Composite PMI also ticked down to 54.3 instead of the forecast flat hold at 55.0. Still, a glimmer of hope on the data front: the ISM Services PMI for July rose to 51.4 on Monday, beating the forecast increase to 51.0 from the previous 48.8.
After the assassination of two of Iran and Hezbollah’s militant leaders last week, markets are bracing for an expected escalation in the Middle East conflict that has been bubbling for months. Iran is expected to retaliate directly against Israel for its hand in assassinations that took place in Beirut and Tehran, and the US is deploying warships to the region in an effort to stave off a further widening of the conflict.
Dow Jones news
The Dow Jones plummeted to a 1,300 point decline from Friday’s close in early Monday trading as the entire stock index prints in the red. All US sectors are down on Monday, with losses being led by Intel Corp. (INTC), which fell -6.3% and is approaching $20.00 per share after the software company announced a minor miss in second-quarter revenue and slightly lowered forward guidance on revenue for the current quarter.
Dow Jones technical outlook
Monday’s bearish plunge dragged the Dow Jones to an eight-week low of 38,382.90. Bids have fallen with touch range of the 200-day Exponential Moving Average (EMA) at 38,108.94, a feat that hasn’t been accomplished since the DJIA soared back over the long-term moving average in November of last year.
Despite near-term declines dragging the Dow Jones into correction territory, down around -7% peak-to-trough from all-time highs set above the 40,000.00 major price handle, price action still has a long way to go before testing full-on bear country at the 20% contraction mark near 33,108.00.
Dow Jones daily chart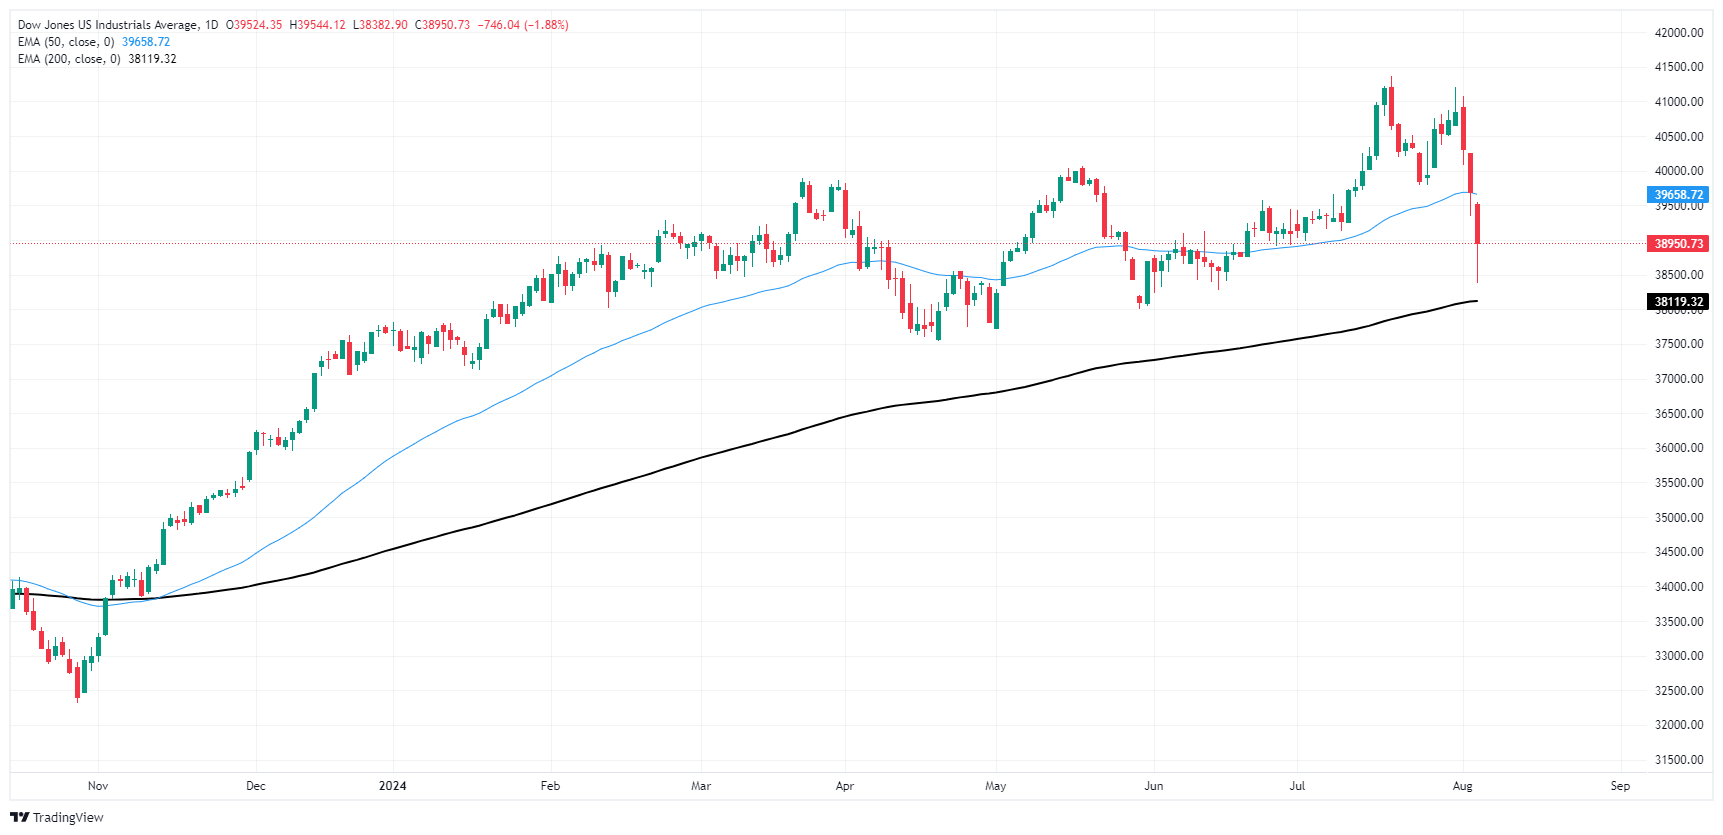
Dow Jones FAQs
The Dow Jones Industrial Average, one of the oldest stock market indices in the world, is compiled of the 30 most traded stocks in the US. The index is price-weighted rather than weighted by capitalization. It is calculated by summing the prices of the constituent stocks and dividing them by a factor, currently 0.152. The index was founded by Charles Dow, who also founded the Wall Street Journal. In later years it has been criticized for not being broadly representative enough because it only tracks 30 conglomerates, unlike broader indices such as the S&P 500.
Many different factors drive the Dow Jones Industrial Average (DJIA). The aggregate performance of the component companies revealed in quarterly company earnings reports is the main one. US and global macroeconomic data also contributes as it impacts on investor sentiment. The level of interest rates, set by the Federal Reserve (Fed), also influences the DJIA as it affects the cost of credit, on which many corporations are heavily reliant. Therefore, inflation can be a major driver as well as other metrics which impact the Fed decisions.
Dow Theory is a method for identifying the primary trend of the stock market developed by Charles Dow. A key step is to compare the direction of the Dow Jones Industrial Average (DJIA) and the Dow Jones Transportation Average (DJTA) and only follow trends where both are moving in the same direction. Volume is a confirmatory criteria. The theory uses elements of peak and trough analysis. Dow’s theory posits three trend phases: accumulation, when smart money starts buying or selling; public participation, when the wider public joins in; and distribution, when the smart money exits.
There are a number of ways to trade the DJIA. One is to use ETFs which allow investors to trade the DJIA as a single security, rather than having to buy shares in all 30 constituent companies. A leading example is the SPDR Dow Jones Industrial Average ETF (DIA). DJIA futures contracts enable traders to speculate on the future value of the index and Options provide the right, but not the obligation, to buy or sell the index at a predetermined price in the future. Mutual funds enable investors to buy a share of a diversified portfolio of DJIA stocks thus providing exposure to the overall index.
Author

Joshua Gibson
FXStreet
Joshua joins the FXStreet team as an Economics and Finance double major from Vancouver Island University with twelve years' experience as an independent trader focusing on technical analysis.


