Dow Jones Industrial Average gains ground as investors brush off tariff bluster
- The Dow Jones climbed 500 points on Tuesday as investors brush off tariff fears.
- President Donald Trump pivoted on his threats of day-one tariffs.
- Tariff threats from the White House are still leaking through, now for February.

The Dow Jones Industrial Average (DJIA) absorbed newly-minted President Donald Trump’s last-minute pivot away from enacting sweeping tariffs on his first day in office with jubilation. The major equity index climbed over 500 points and is now testing the 44,000 handle for the first time since mid-December.
Equity markets caught a firm bid after incoming President Donald Trump failed to enact a package of tariffs that would have levied significant fees across the board on most imported goods on his first day in office. Donald Trump is still pushing his threats of enacting stiff import taxes on some of his closest allies, including Canada and Mexico, but investors are willing to call his bluff now that tariffs have fallen into the usual cycle of eternally coming “in a couple of weeks”, a common box that many of Donald Trump’s bespoke campaign promises tend to fall into.
Economic data remains limited throughout the rest of the week, at least until Friday’s S&P Global Purchasing Managers Index (PMI) print, leaving investors to grapple with political headlines as traders readjust to life under the ‘Trump two-step’. After a four-year hiatus, traders will have to get comfortable with Presidential musings delivered via social media apps and inconsistent policy claims that clash with previous statements, often sent only hours apart.
Dow Jones news
All but five of the Dow Jones’ listed securities are gaining ground on Tuesday, with gains being led by 3M (MMM) leading the charge higher after a firm beat of Q4 earnings forecasts. 3M’s fourth-quarter performance outpaced analyst expectations enough to earn a 5% upswing to $148 per share, although the company’s annualized performance came in slightly softer than expected.
Dow Jones price forecast
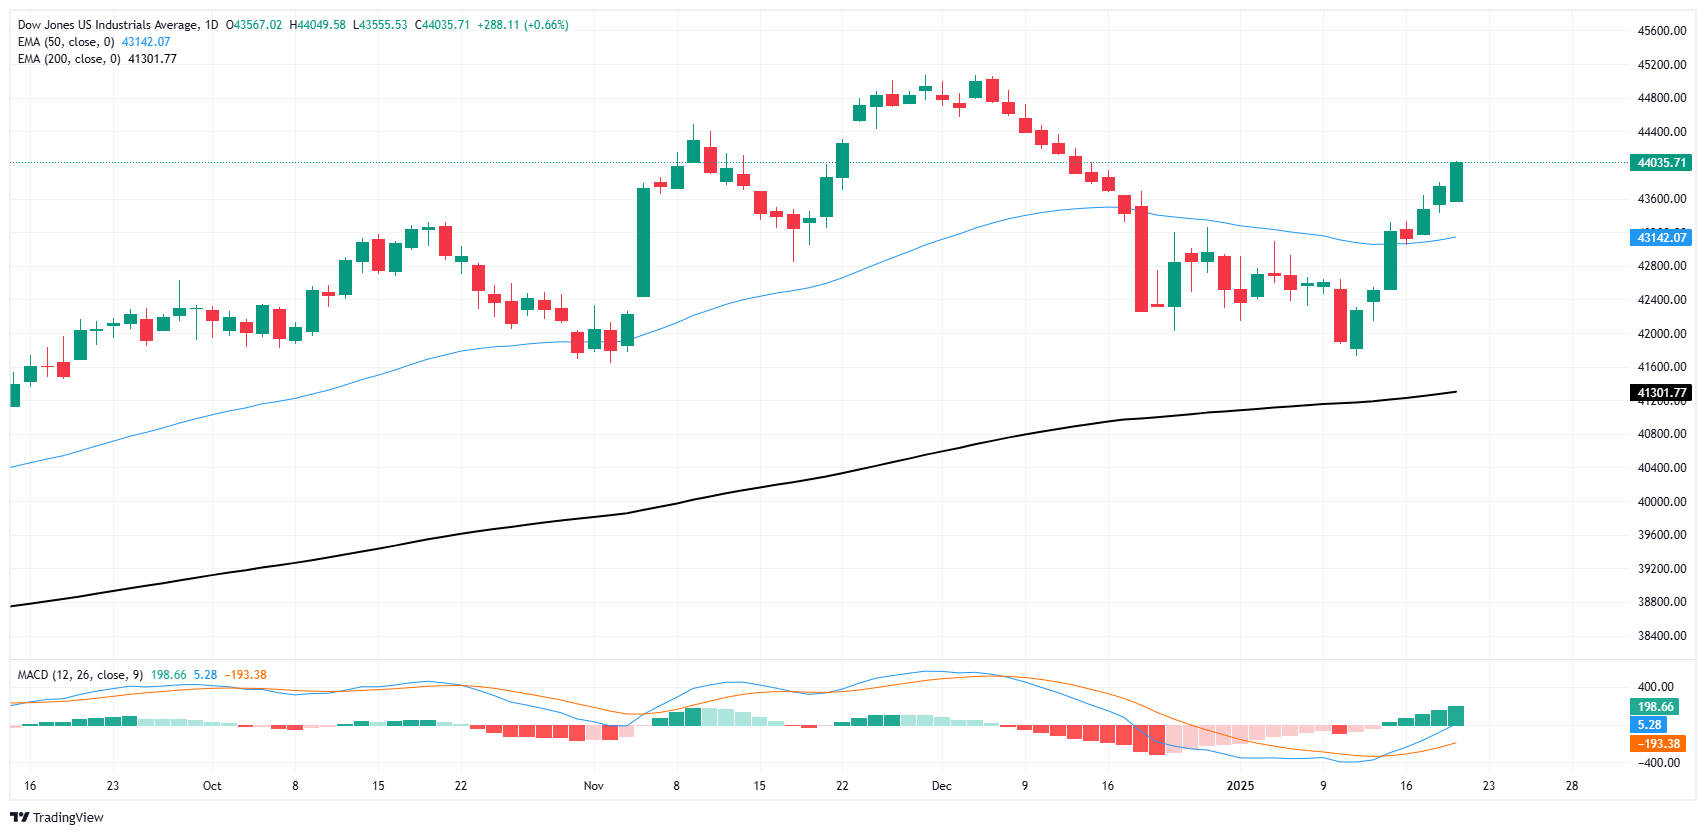
The Dow Jones gained further ground on Tuesday as investors bid the index back into the high end, keeping their eyes locked on record peaks set in late November just above 45,000. Despite a recent slow grind into the low end, price action has pivoted firmly bullish in the near-term, with all but one of the last six straight trading sessions closing higher.
More patient technical traders will be waiting for a fresh stop and a pullback to confirm a higher low before reloading on fresh bids. Despite a firm bounce, the Dow’s strong plunge from record highs dragged the index worryingly close to the 200-day Exponential Moving Average (EMA) near 41,300.
Dow Jones daily chart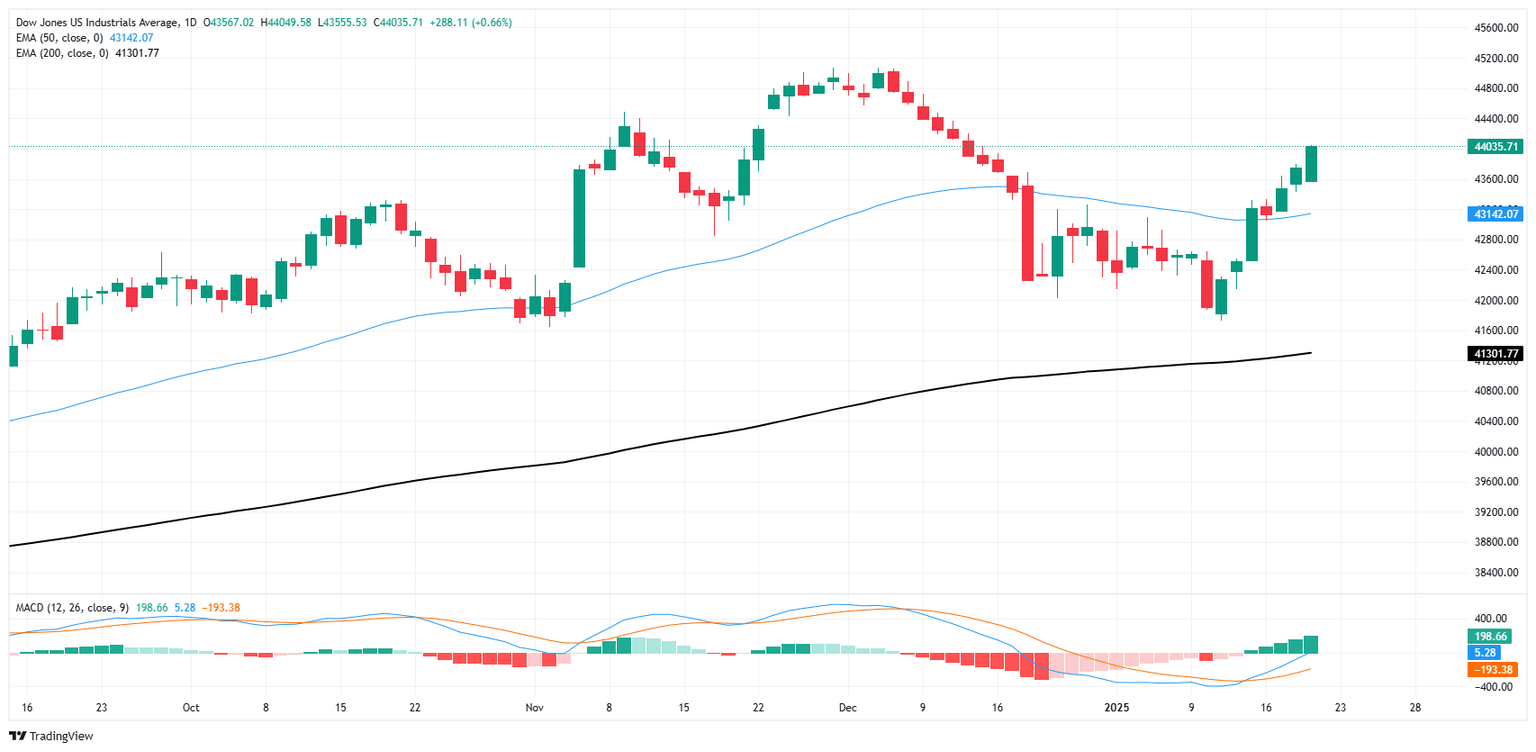
Dow Jones FAQs
The Dow Jones Industrial Average, one of the oldest stock market indices in the world, is compiled of the 30 most traded stocks in the US. The index is price-weighted rather than weighted by capitalization. It is calculated by summing the prices of the constituent stocks and dividing them by a factor, currently 0.152. The index was founded by Charles Dow, who also founded the Wall Street Journal. In later years it has been criticized for not being broadly representative enough because it only tracks 30 conglomerates, unlike broader indices such as the S&P 500.
Many different factors drive the Dow Jones Industrial Average (DJIA). The aggregate performance of the component companies revealed in quarterly company earnings reports is the main one. US and global macroeconomic data also contributes as it impacts on investor sentiment. The level of interest rates, set by the Federal Reserve (Fed), also influences the DJIA as it affects the cost of credit, on which many corporations are heavily reliant. Therefore, inflation can be a major driver as well as other metrics which impact the Fed decisions.
Dow Theory is a method for identifying the primary trend of the stock market developed by Charles Dow. A key step is to compare the direction of the Dow Jones Industrial Average (DJIA) and the Dow Jones Transportation Average (DJTA) and only follow trends where both are moving in the same direction. Volume is a confirmatory criteria. The theory uses elements of peak and trough analysis. Dow’s theory posits three trend phases: accumulation, when smart money starts buying or selling; public participation, when the wider public joins in; and distribution, when the smart money exits.
There are a number of ways to trade the DJIA. One is to use ETFs which allow investors to trade the DJIA as a single security, rather than having to buy shares in all 30 constituent companies. A leading example is the SPDR Dow Jones Industrial Average ETF (DIA). DJIA futures contracts enable traders to speculate on the future value of the index and Options provide the right, but not the obligation, to buy or sell the index at a predetermined price in the future. Mutual funds enable investors to buy a share of a diversified portfolio of DJIA stocks thus providing exposure to the overall index.
Author

Joshua Gibson
FXStreet
Joshua joins the FXStreet team as an Economics and Finance double major from Vancouver Island University with twelve years' experience as an independent trader focusing on technical analysis.


