Dow Jones Industrial Average clips fresh record high as consumer sentiment climbs
- Dow Jones tapped 44,000 for the first time ever on Friday.
- Equities are extending a near-term bullish push to wrap up the trading week.
- UoM sentiment survey results came in much better than expected.

The Dow Jones Industrial Average (DJIA) rose into fresh all-time highs on Friday, clipping into 44,000 as stocks lean firmly bullish to close out a record week. The Dow had its best week since October of 2023, rising nearly 5% and piercing record bids three days in a row.
The University of Michigan (UoM) Consumer Sentiment Index rose to 73.0 in November, overshooting the expected print of 71.0 and climbing further above October’s 70.5 as polled consumers tilt cautiously optimistic regarding the everall state of the US economy. On the downside, 5-year Consumer Inflation Expectations also ticked higher once again, rising to 3.1% compared to the previous print of 3.0%.
A decisive election win for former President Donald Trump helped to send stocks soaring this week, and a follow-up 25 bps interest rate trim from the Federal Reserve (Fed) kept the gas pedal pinned to the floor. Friday's uptick in consumer outlook survey results only keeps stock traders leaning into the buy button.
Dow Jones news
Over two-thirds of the Dow Jones index found room on the high end on Friday, with most equities ending the week higher than they started. McDonald’s (MCD), Unitedhealth (UNH), and Procter & Gamble (PG) all ended Friday up around 2%, with MCD breaking above $300 per share for the first time in several weeks.
On the low end, Caterpillar (CAT) backslide around 3.5%, falling below $395 per share and extending its earnings miss decline after the company’s revenue fell 4% YoY. According to a statement from Caterpillar, the decline was a result of “lower sales of equipment to end users”, adding on that “changes in dealer inventories had an unfavourable impact to sales volume.”
Dow Jones price forecast
With the Dow Jones holding stubbornly in record high territory, a technical case for short momentum appears frustratingly impossible. By all measures, the DJIA is pinned far too deep into overbought territory to consider a fresh bid, but continued topside momentum has left the chart entirely absent any technical short entry points.
“Winners keep winning” is the approach to a long-run Dow Jones bullish trend. The major equity index has entirely outpaced its own 200-day Exponential Moving Average (EMA) for an entire year. Despite a brief reprieve in October, the Dow Jones has continued its one-sided bullish tilt, closing in the green for all but two of the last 11 consecutive months and on pace to chalk in another gain month in November as long as bidders maintain their balance.
Dow Jones daily chart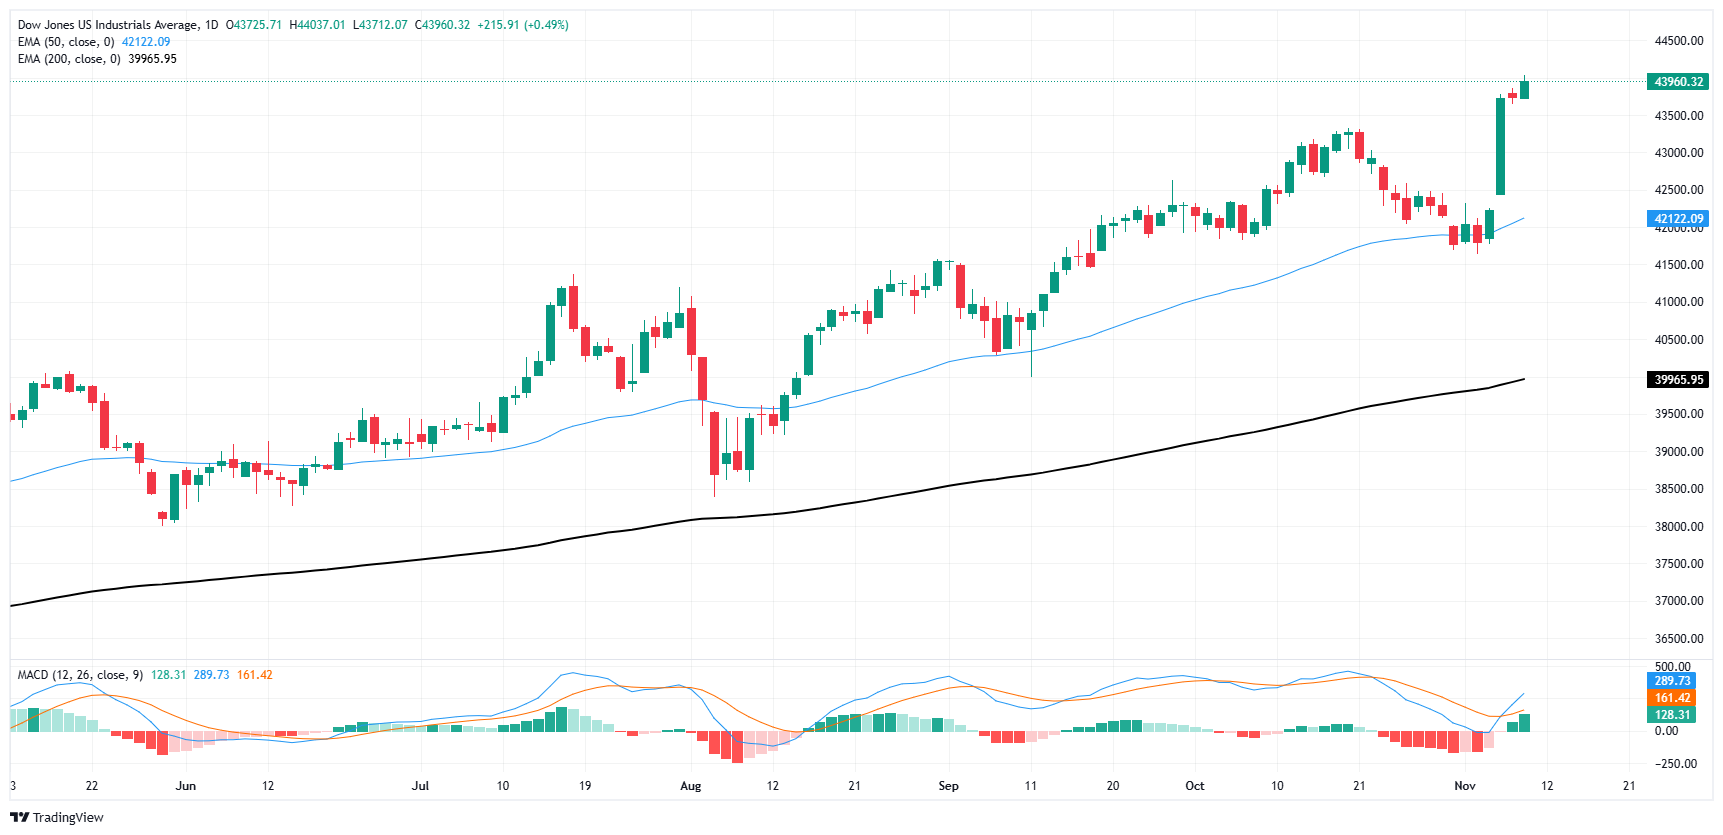
Dow Jones FAQs
The Dow Jones Industrial Average, one of the oldest stock market indices in the world, is compiled of the 30 most traded stocks in the US. The index is price-weighted rather than weighted by capitalization. It is calculated by summing the prices of the constituent stocks and dividing them by a factor, currently 0.152. The index was founded by Charles Dow, who also founded the Wall Street Journal. In later years it has been criticized for not being broadly representative enough because it only tracks 30 conglomerates, unlike broader indices such as the S&P 500.
Many different factors drive the Dow Jones Industrial Average (DJIA). The aggregate performance of the component companies revealed in quarterly company earnings reports is the main one. US and global macroeconomic data also contributes as it impacts on investor sentiment. The level of interest rates, set by the Federal Reserve (Fed), also influences the DJIA as it affects the cost of credit, on which many corporations are heavily reliant. Therefore, inflation can be a major driver as well as other metrics which impact the Fed decisions.
Dow Theory is a method for identifying the primary trend of the stock market developed by Charles Dow. A key step is to compare the direction of the Dow Jones Industrial Average (DJIA) and the Dow Jones Transportation Average (DJTA) and only follow trends where both are moving in the same direction. Volume is a confirmatory criteria. The theory uses elements of peak and trough analysis. Dow’s theory posits three trend phases: accumulation, when smart money starts buying or selling; public participation, when the wider public joins in; and distribution, when the smart money exits.
There are a number of ways to trade the DJIA. One is to use ETFs which allow investors to trade the DJIA as a single security, rather than having to buy shares in all 30 constituent companies. A leading example is the SPDR Dow Jones Industrial Average ETF (DIA). DJIA futures contracts enable traders to speculate on the future value of the index and Options provide the right, but not the obligation, to buy or sell the index at a predetermined price in the future. Mutual funds enable investors to buy a share of a diversified portfolio of DJIA stocks thus providing exposure to the overall index.
Author

Joshua Gibson
FXStreet
Joshua joins the FXStreet team as an Economics and Finance double major from Vancouver Island University with twelve years' experience as an independent trader focusing on technical analysis.


