Dow Jones Industrial Average whips on cautious new trading year
- The Dow Jones cycled near familiar levels on the first trading day of 2025.
- Tepid intraday flows crimp hopes for a ‘Santa Clause rally’.
- Initial Jobless Claims improved, but not enough to spark a firm risk-on bid.

The Dow Jones Industrial Average (DJIA) fizzled on Thursday, kicking off the 2025 trading year with a flat performance and churning chart paper near 42,500. Equities were middling overall during the US market session, with early gains reversing through the day.
The first week of 2025 remains thin on the economic calendar overall, though US ISM Manufacturing Purchasing Managers Index (PMI) survey results are due on Friday. US Initial Jobless Claims rose 211K through the week ended December 27, below the forecast uptick to 222K from the previous week’s revised print of 220K.
Dow Jones news
Roughly a third of the Dow Jones’ constituent stocks are in the green on Thursday, with Nvidia (NVDA) rebounding 1.8% after a near-term dip and rising toward $137 per share. Despite the upswing in 2024’s tech rally darling, concentrated losses in other market favorites including Boeing (BA) and Apple (AAPL) are keeping the DJIA hobbled for the new year, with both companies falling 3.5% and 3%, respectively.
Dow Jones price forecast
The Dow’s mixed performance on Thursday has chalked a wide range into the intraday chart with the major equity index starting the day with a 300-point gain before reversing course and backsliding to a -300 loss. The DJIA peaked just north of 42,800 before falling back below 42,250.
Bearish flows from the tail-end of 2024 are continuing into the new year, keeping the Dow capped below the 50-day Exponential Moving Average (EMA) which is rolling over into a bearish stance below 43,270. If bearish momentum accelerates, it’ll put the DJIA on pace for a fresh challenge of the 200-day EMA near 42,120.
Dow Jones daily chart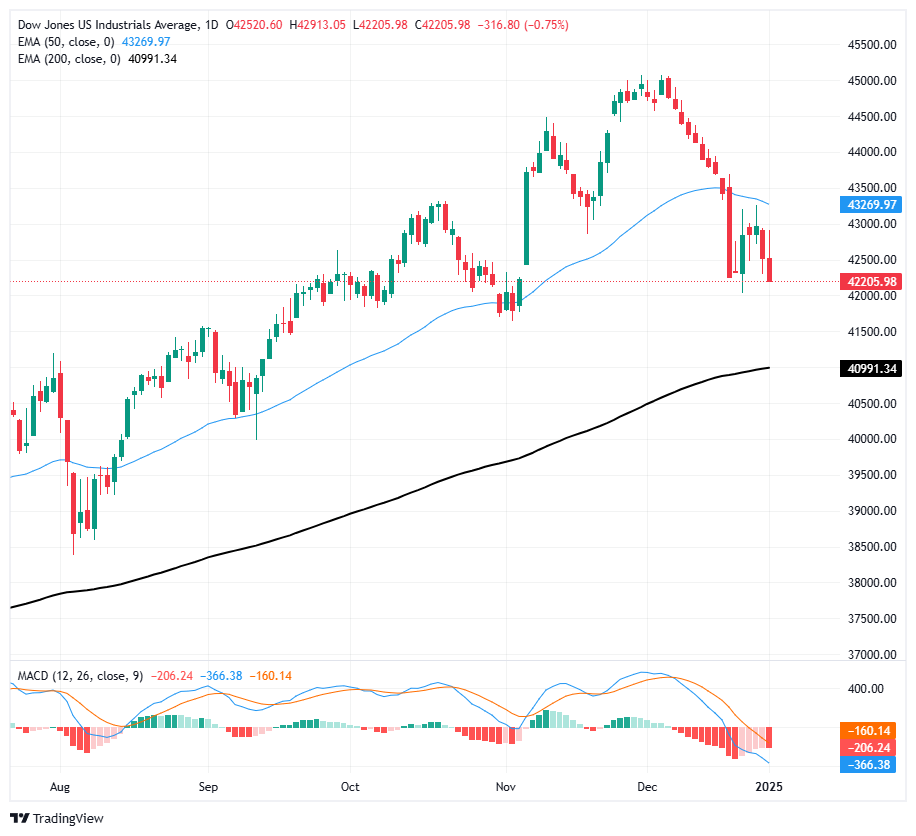
Economic Indicator
Initial Jobless Claims
The Initial Jobless Claims released by the US Department of Labor is a measure of the number of people filing first-time claims for state unemployment insurance. A larger-than-expected number indicates weakness in the US labor market, reflects negatively on the US economy, and is negative for the US Dollar (USD). On the other hand, a decreasing number should be taken as bullish for the USD.
Read more.Last release: Thu Jan 02, 2025 13:30
Frequency: Weekly
Actual: 211K
Consensus: 222K
Previous: 219K
Source: US Department of Labor
Every Thursday, the US Department of Labor publishes the number of previous week’s initial claims for unemployment benefits in the US. Since this reading could be highly volatile, investors may pay closer attention to the four-week average. A downtrend is seen as a sign of an improving labour market and could have a positive impact on the USD’s performance against its rivals and vice versa.
Author

Joshua Gibson
FXStreet
Joshua joins the FXStreet team as an Economics and Finance double major from Vancouver Island University with twelve years' experience as an independent trader focusing on technical analysis.


