Dow Jones Industrial Average teases inflation cooloff, sparks fresh rate cut hopes
- The Dow Jones tested higher ground after US producer inflation chilled in December.
- Despite an uptick in investor sentiment, markets are still apprehensive.
- Investors await Wednesday’s key CPI inflation print before making decisions.

The Dow Jones Industrial Average (DJIA) lurched around 150 points higher on Tuesday after Producer Price Index (PPI) inflation printed below median market forecasts. Treasury yields ticked down and equities explored the higher end after cooling inflation pressures gave investors a reason to look forward to key Consumer Price Index (CPI) inflation figures due on Wednesday. Stocks saw a bit of back-and-forth before settling Tuesday up slightly from where they started, testing 42,500.
PPI inflation figures eased broadly below expectations in December, with headline PPI printing at just 0.2% MoM. Investors were expecting a downtick to 0.3% from the previous 0.4%. Core PPI, excluding price increases in volatile food and energy prices, was flat in December versus the forecast of 0.3% and 0.2% last.
Annualized PPI inflation tells a slightly different story: headline PPI inflation rose to 3.3% YoY versus the previous figure of 3.0%, while core PPI accelerated to 3.5% YoY compared to the previous 3.4%. While both figures came in below expectations, the print wasn’t quite the boon to investor sentiment that many were hoping for as inflation pressures continue to simmer away in the background, albeit at a slightly lower boil than economists forecast. With inflation metrics still trending well above annualized Federal Reserve (Fed) targets, PPI figures printing below forecasts is a distinction without a difference when it comes to expectations of interest rate decreases.
Dow Jones news
Roughly half of the Dow Jones board is in the green on Tuesday, though steeper losses in key favorites are keeping the overall index slightly underwater for the day. Boeing (BA) backslid around 3%, falling to $165 per share after the aerospace manufacturer reported fewer customer deliveries than analysts expected. Boeing is slated to release its latest earnings report on January 28.
Salesforce (CRM) and Caterpillar (CAT) are two of the big winners on the Dow, rising around 1.5% apiece as investors continues to pivot out of tech favorites and bid up adjacent-industry familiars. CRM is knocking on $324 per share while CAT is trading into $368 per share.
Dow Jones price forecast
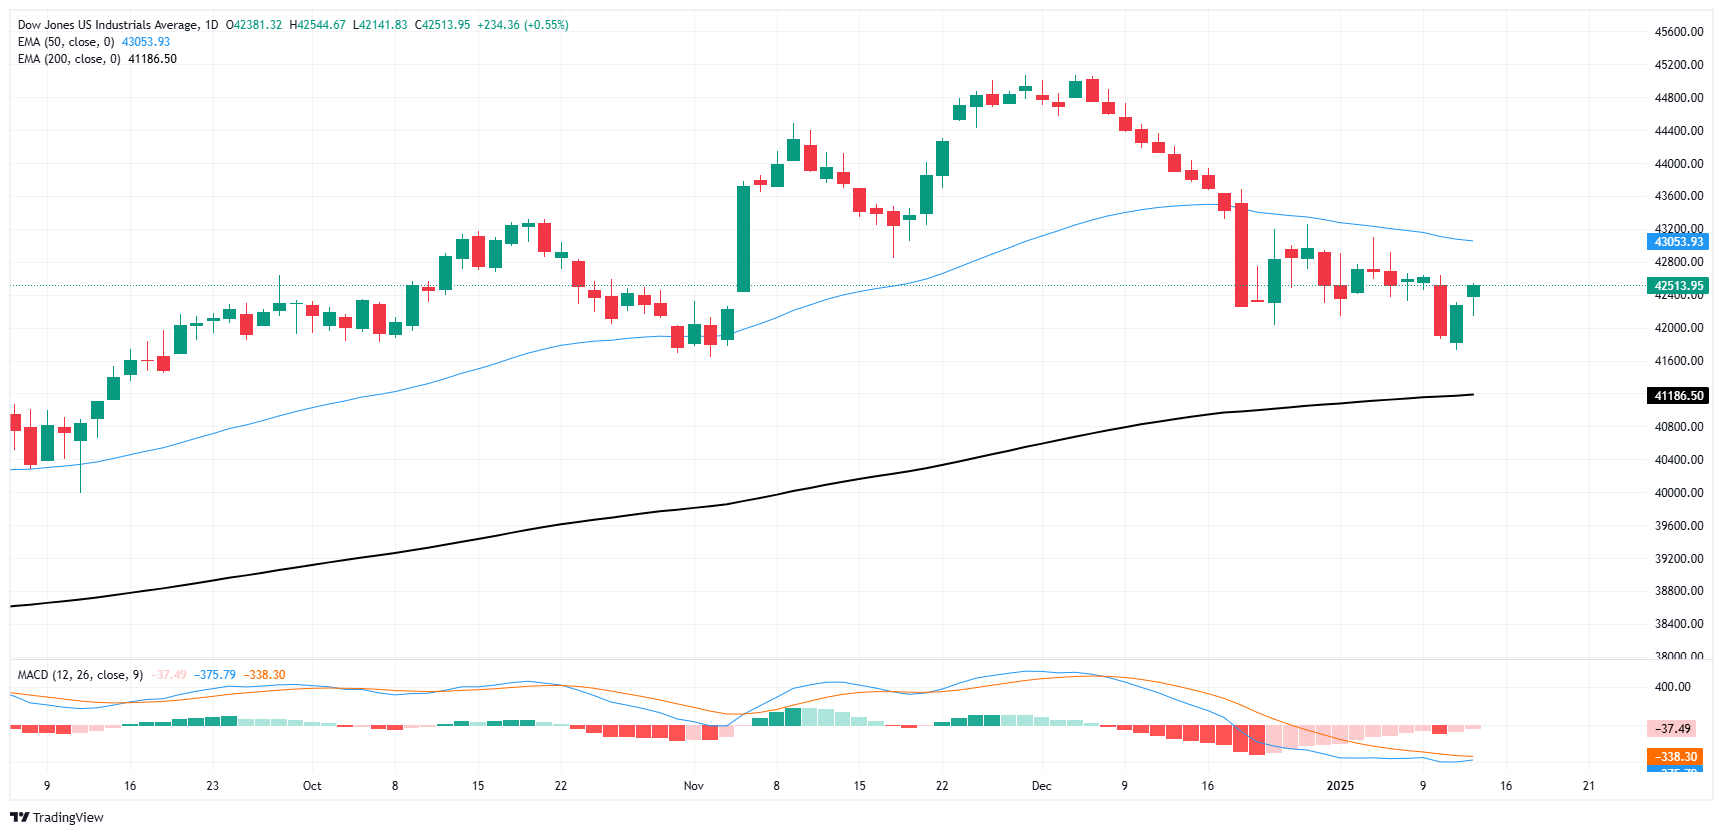
The Dow Jones is discovering some chart churn as bidders look to dig in some footholds above the 42,000 major price handle. The major equity index has backslid 7.4% top-to-bottom from record bids near 45,070 set in late November. Bulls are struggling to catch the backslide as the 200-day Exponential Moving Average (EMA) comes into view, and price action is poised to tap the key long-term average for the first time since November of 2023.
The immediate barrier to a technical recovery will be the 50-day EMA falling into 43,040. A near-term technical floor appears to be firming up at 42,000, but a fresh push into the low end could see supports snap.
Dow Jones daily chart
Dow Jones FAQs
The Dow Jones Industrial Average, one of the oldest stock market indices in the world, is compiled of the 30 most traded stocks in the US. The index is price-weighted rather than weighted by capitalization. It is calculated by summing the prices of the constituent stocks and dividing them by a factor, currently 0.152. The index was founded by Charles Dow, who also founded the Wall Street Journal. In later years it has been criticized for not being broadly representative enough because it only tracks 30 conglomerates, unlike broader indices such as the S&P 500.
Many different factors drive the Dow Jones Industrial Average (DJIA). The aggregate performance of the component companies revealed in quarterly company earnings reports is the main one. US and global macroeconomic data also contributes as it impacts on investor sentiment. The level of interest rates, set by the Federal Reserve (Fed), also influences the DJIA as it affects the cost of credit, on which many corporations are heavily reliant. Therefore, inflation can be a major driver as well as other metrics which impact the Fed decisions.
Dow Theory is a method for identifying the primary trend of the stock market developed by Charles Dow. A key step is to compare the direction of the Dow Jones Industrial Average (DJIA) and the Dow Jones Transportation Average (DJTA) and only follow trends where both are moving in the same direction. Volume is a confirmatory criteria. The theory uses elements of peak and trough analysis. Dow’s theory posits three trend phases: accumulation, when smart money starts buying or selling; public participation, when the wider public joins in; and distribution, when the smart money exits.
There are a number of ways to trade the DJIA. One is to use ETFs which allow investors to trade the DJIA as a single security, rather than having to buy shares in all 30 constituent companies. A leading example is the SPDR Dow Jones Industrial Average ETF (DIA). DJIA futures contracts enable traders to speculate on the future value of the index and Options provide the right, but not the obligation, to buy or sell the index at a predetermined price in the future. Mutual funds enable investors to buy a share of a diversified portfolio of DJIA stocks thus providing exposure to the overall index.
Author

Joshua Gibson
FXStreet
Joshua joins the FXStreet team as an Economics and Finance double major from Vancouver Island University with twelve years' experience as an independent trader focusing on technical analysis.


