Dow Jones Industrial Average grinds flat on Friday as US PMI beats crimp rate cut hopes
- Dow Jones struggles in flat territory as investors roil at upbeat US data.
- Rate-cut-hungry markets balk as US economic figures continue to beat the street.
- US PMIs rose in June as business activity expectations turn upbeat.

The Dow Jones Industrial Average (DJIA) stubbornly flattened on Friday, treading water after US equity markets were disappointed by a better-than-expected print in June’s US Purchasing Managers Index (PMI) figures. Markets hoping for a not-too-steep decline in US economic data to push the Federal Reserve (Fed) towards rate cuts were disappointed by upbeat activity survey results, leaning into the “bad news is good news” narrative driving financial markets singularly focused on achieving cheaper lending and financing rates from the Fed.
US PMIs broadly beat Wall Street forecasts in June, with the S&P Global Manufacturing PMI rising to 51.7 from the previous month’s 51.3, snubbing a forecast decline to 51.0. The Services component also increased, climbing to 55.1, it’s highest print since May 2022. The previous month had printed at 54.8, and markets had forecast a decline to 53.7.
On the downside, US Existing Home Sales eased back to 4.11 million units MoM in May, a -0.7% slip from the previous 4.14 million, but still a smaller decline than the forecast 4.10 million. Despite Friday’s mildly higher print in PMIs, markets continue to pin hopes on a September rate cut from the Fed. According to the CME’s FedWatch Tool, rate traders are still pricing in around 65% odds of at least a quarter-point rate trim at the Federal Open Market Committee’s (FOMC) September 18 rate decision.
Dow Jones news
On Friday, about two-thirds of the Dow Jones’ constituent securities were in the green, but gains remained tepid. McDonald’s Corp. (MCD) led the gainers, climbing 2.4% to $260.00 per share as the fast food chain wades into the social consciousness surrounding inflation pressures with competitive pricing on strategic menu offerings. The food chain also announced it was ditching AI integration after its bespoke “Automated Order Taker” proved woefully ill-equipped to handle real-world operations at scale.
On the downside, the banking sector waffled as interest rate hopes battle upbeat US data; JPMorgan Chase & Co. (JPM) fell back 1.25% to $196.20 per share with Goldman Sachs Group Inc. (GS) falling around the same to $452.50 per share.
Dow Jones technical outlook
The Dow Jones is flat on Friday, trading in a tight range in intraday action as the index struggles to find the momentum to reclaim 39,200.00. The DJIA briefly set a fresh peak for the week near 39,260.00 before returning to the day’s opening range.
Daily candlesticks have lept back over the 50-day Exponential Moving Average (EMA) at 38,825.00, extending a recovery from a recent plunge to the 38,000.00 region.
Dow Jones five minute chart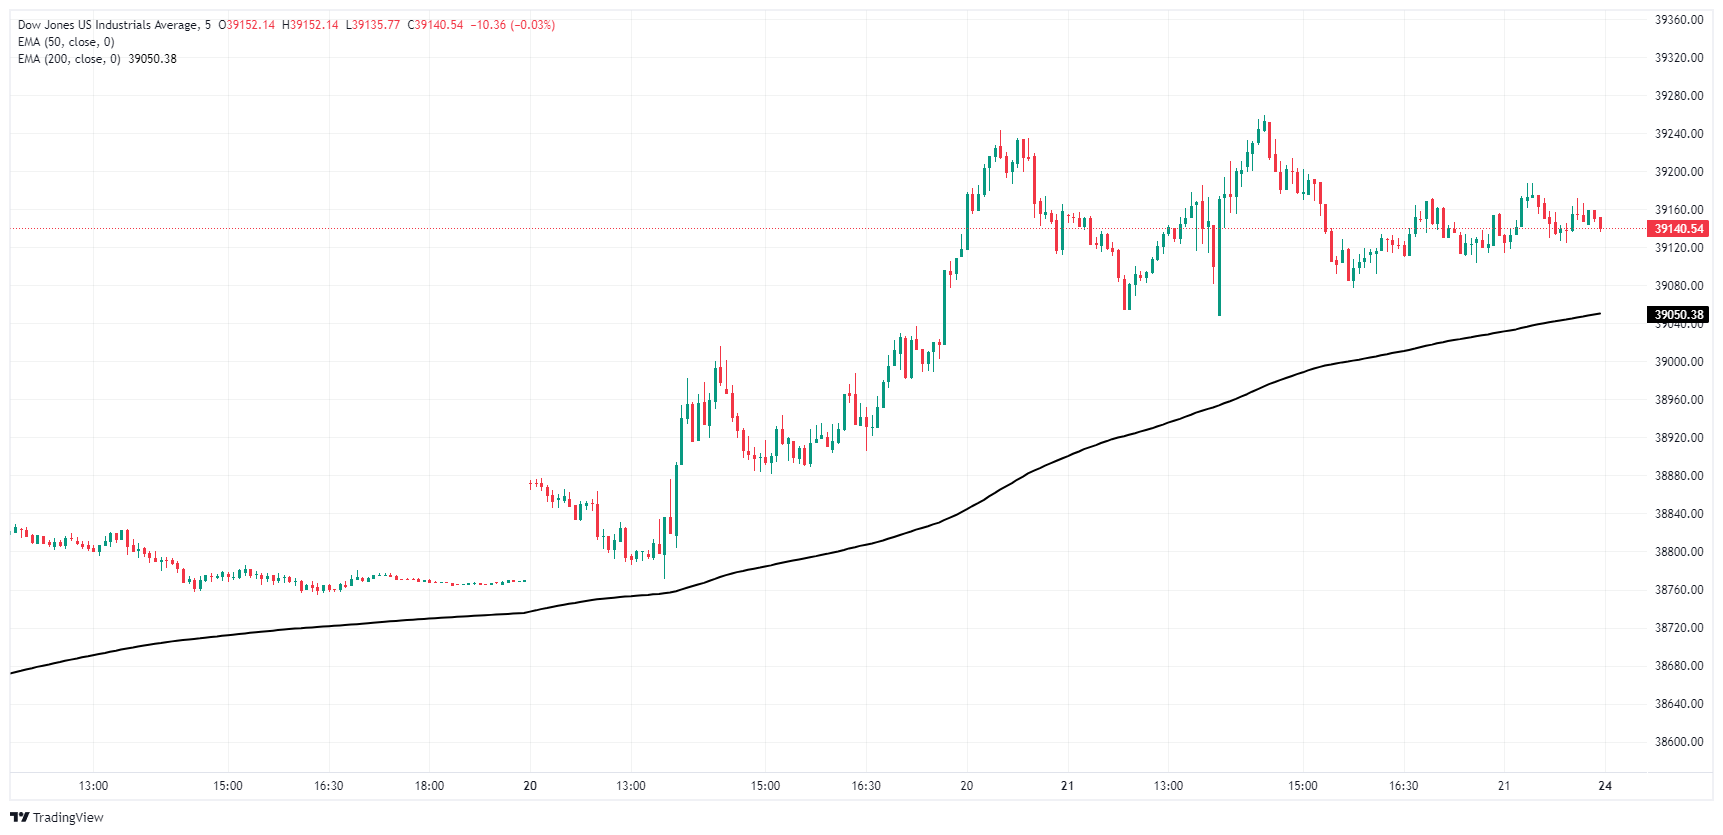
Dow Jones daily chart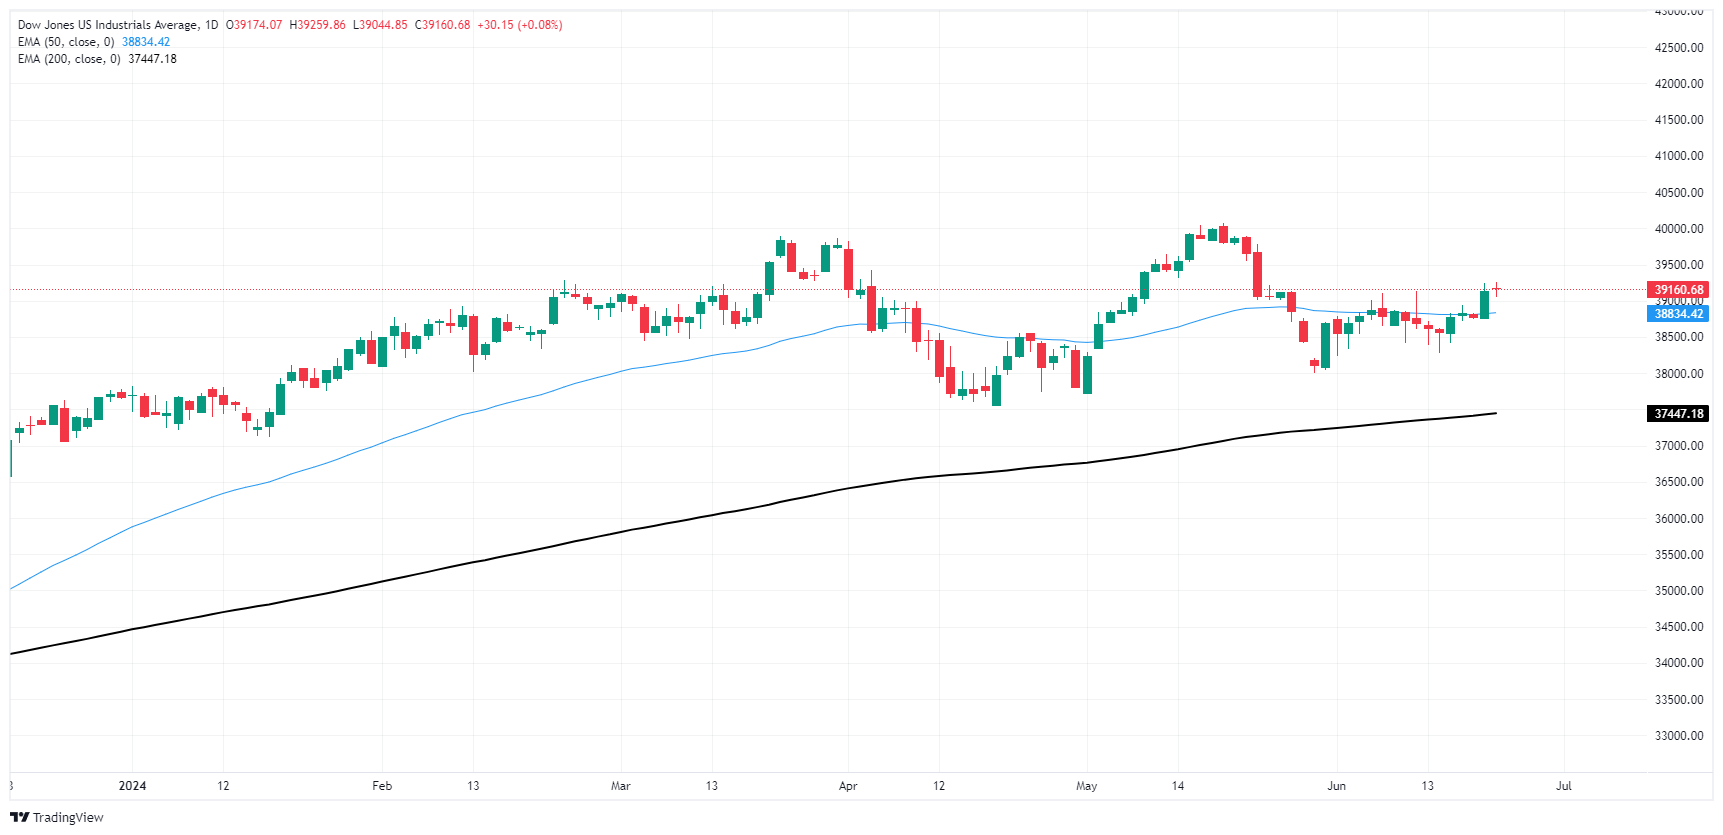
Dow Jones FAQs
The Dow Jones Industrial Average, one of the oldest stock market indices in the world, is compiled of the 30 most traded stocks in the US. The index is price-weighted rather than weighted by capitalization. It is calculated by summing the prices of the constituent stocks and dividing them by a factor, currently 0.152. The index was founded by Charles Dow, who also founded the Wall Street Journal. In later years it has been criticized for not being broadly representative enough because it only tracks 30 conglomerates, unlike broader indices such as the S&P 500.
Many different factors drive the Dow Jones Industrial Average (DJIA). The aggregate performance of the component companies revealed in quarterly company earnings reports is the main one. US and global macroeconomic data also contributes as it impacts on investor sentiment. The level of interest rates, set by the Federal Reserve (Fed), also influences the DJIA as it affects the cost of credit, on which many corporations are heavily reliant. Therefore, inflation can be a major driver as well as other metrics which impact the Fed decisions.
Dow Theory is a method for identifying the primary trend of the stock market developed by Charles Dow. A key step is to compare the direction of the Dow Jones Industrial Average (DJIA) and the Dow Jones Transportation Average (DJTA) and only follow trends where both are moving in the same direction. Volume is a confirmatory criteria. The theory uses elements of peak and trough analysis. Dow’s theory posits three trend phases: accumulation, when smart money starts buying or selling; public participation, when the wider public joins in; and distribution, when the smart money exits.
There are a number of ways to trade the DJIA. One is to use ETFs which allow investors to trade the DJIA as a single security, rather than having to buy shares in all 30 constituent companies. A leading example is the SPDR Dow Jones Industrial Average ETF (DIA). DJIA futures contracts enable traders to speculate on the future value of the index and Options provide the right, but not the obligation, to buy or sell the index at a predetermined price in the future. Mutual funds enable investors to buy a share of a diversified portfolio of DJIA stocks thus providing exposure to the overall index.
Author

Joshua Gibson
FXStreet
Joshua joins the FXStreet team as an Economics and Finance double major from Vancouver Island University with twelve years' experience as an independent trader focusing on technical analysis.


