Dow Jones Industrial Average sunk 400 points on Wednesday
- The Dow Jones bottomed out around 550 points lower, or over 1.3% on Wednesday.
- Markets have returned to worrying that interest rates will stick higher for longer.
- Sharp declines in key equities are exacerbating declines.

The Dow Jones Industrial Average (DJIA) is set to grapple with a losing week, something the major equity index hasn’t had to do since August. The Dow turned further bearish on Wednesday, dropping over 550 points at its peak and shedding over 1.3% from the day’s opening bids. The DJIA wrapped up Wednesday 400 points lower, shedding nearly a full percent over the day after a meager recovery from the day's lows.
Despite a jumbo 50 bps rate cut from the Federal Reserve (Fed) in September, markets have again returned to fretting about the possibility of higher-for-longer interest rates. Bond yields stepped higher on Wednesday, prompting an overall decline in equities in a self-fulfilling prophecy: investors worried about the dizzying heights reached by large-cap equities are beginning to pull back from record highs, trimming overbought equities.
Despite US economic data routinely beating expectations, markets remain concerned that the US economy will begin to feel the long-term effects of high interest rates that reached a 16-year peak of 5.5% in 2023. The Fed released some of the pressure in September by trimming rates by half of a percent, but now investors are turned skeptical that the Fed will be pressured into delivering a projected further 50 bps in rate cuts through the remainder of the year.
Dow Jones news
All but five of the Dow’s listed securities are testing into the red on Wednesday, with losses led by food giant McDonald’s (MCD). It is down around 5% and testing below $300 per share after an E. coli outbreak at one of its food suppliers was announced.
Despite a solid earnings report for the third quarter, investors have decided that 3M’s (MMM) quarterly performance isn’t good enough. The Post-it Note producer’s share price declined around 3.5%, falling below $127 per share.
Dow Jones price forecast
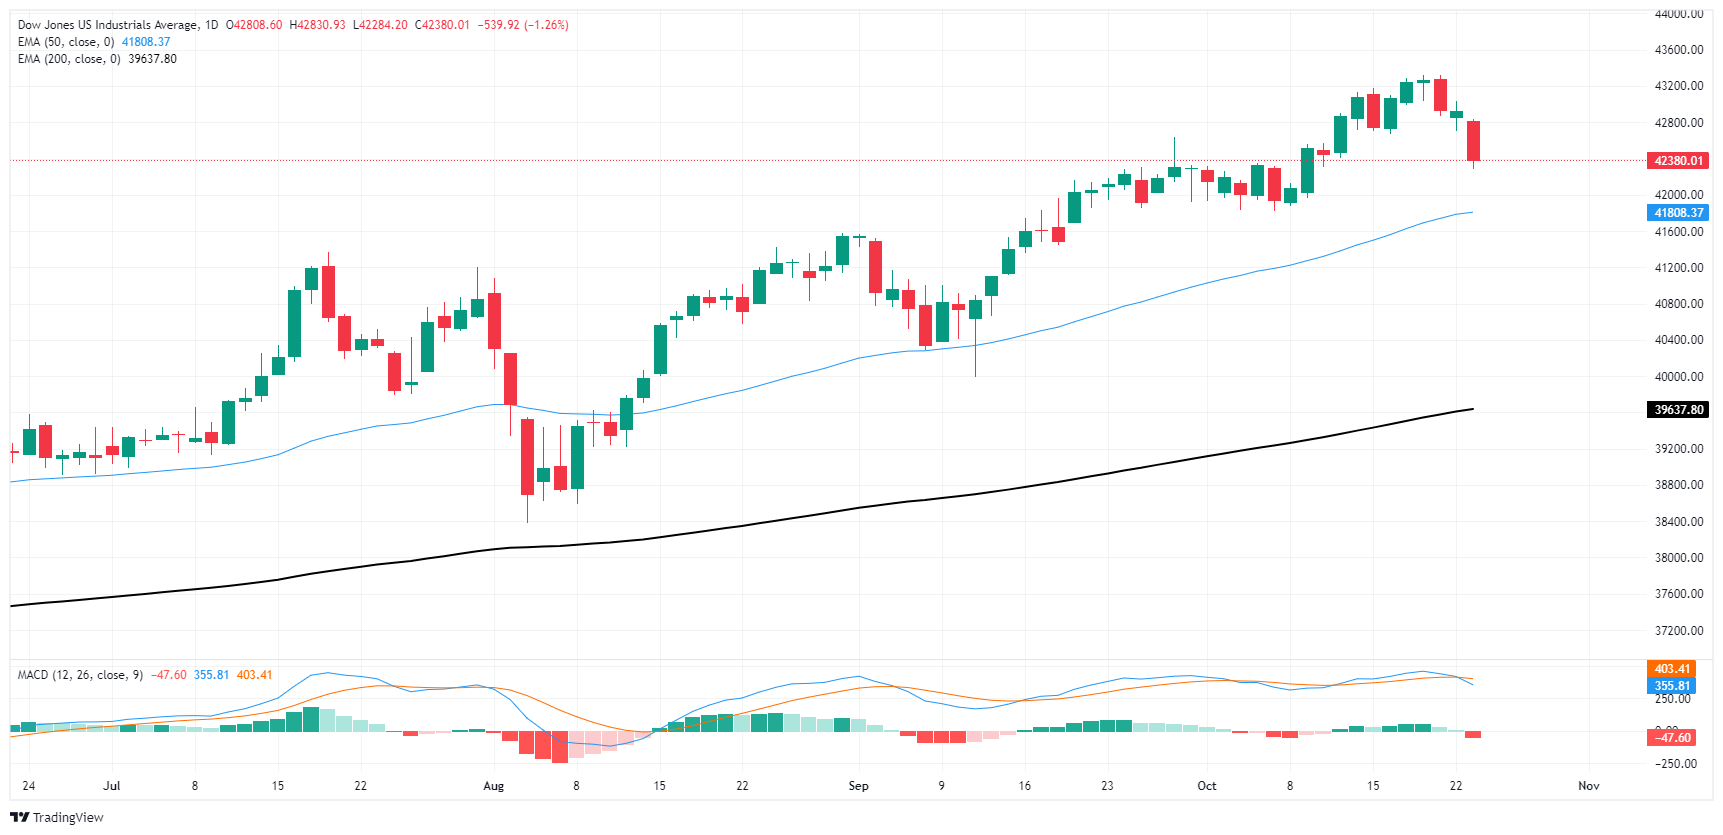
The Dow Jones is experiencing a pullback after rallying since late September. Price action has fallen back below the 43,000 handle, though rising support from the 50-day Exponential Moving Average (EMA) remains well below current bids.
The Moving Average Convergence-Divergence (MCAD) indicator is poised for further declines with the histogram crossing back into negative territory. However, a long-run bull market in the Dow Jones leaves oscillating indicators at a notable disadvantage. Traders looking to go short on the Dow should wait for a bearish confirmation and a pullback to minimize upside risks.
Dow Jones daily chart
Dow Jones FAQs
The Dow Jones Industrial Average, one of the oldest stock market indices in the world, is compiled of the 30 most traded stocks in the US. The index is price-weighted rather than weighted by capitalization. It is calculated by summing the prices of the constituent stocks and dividing them by a factor, currently 0.152. The index was founded by Charles Dow, who also founded the Wall Street Journal. In later years it has been criticized for not being broadly representative enough because it only tracks 30 conglomerates, unlike broader indices such as the S&P 500.
Many different factors drive the Dow Jones Industrial Average (DJIA). The aggregate performance of the component companies revealed in quarterly company earnings reports is the main one. US and global macroeconomic data also contributes as it impacts on investor sentiment. The level of interest rates, set by the Federal Reserve (Fed), also influences the DJIA as it affects the cost of credit, on which many corporations are heavily reliant. Therefore, inflation can be a major driver as well as other metrics which impact the Fed decisions.
Dow Theory is a method for identifying the primary trend of the stock market developed by Charles Dow. A key step is to compare the direction of the Dow Jones Industrial Average (DJIA) and the Dow Jones Transportation Average (DJTA) and only follow trends where both are moving in the same direction. Volume is a confirmatory criteria. The theory uses elements of peak and trough analysis. Dow’s theory posits three trend phases: accumulation, when smart money starts buying or selling; public participation, when the wider public joins in; and distribution, when the smart money exits.
There are a number of ways to trade the DJIA. One is to use ETFs which allow investors to trade the DJIA as a single security, rather than having to buy shares in all 30 constituent companies. A leading example is the SPDR Dow Jones Industrial Average ETF (DIA). DJIA futures contracts enable traders to speculate on the future value of the index and Options provide the right, but not the obligation, to buy or sell the index at a predetermined price in the future. Mutual funds enable investors to buy a share of a diversified portfolio of DJIA stocks thus providing exposure to the overall index.
Author

Joshua Gibson
FXStreet
Joshua joins the FXStreet team as an Economics and Finance double major from Vancouver Island University with twelve years' experience as an independent trader focusing on technical analysis.


