Dow Jones Industrial Average claims new territory on the high side on Thursday
- The Dow Jones climbed over 200 points at its daily peak to clip a new all-time high.
- The AI bid is back in action with chip stocks back on the rise.
- US Retail Sales rebounded in September, beating forecasts across the board.

The Dow Jones Industrial Average (DJIA) found a new all-time high on Thursday, bolstered by investors piling back into the AI stock rally and gaining over 200 points from the day’s opening bids. US Retail Sales handily beat the street, rebounding more than market analysts expected and further propelling equities into the high end.
US Retail Sales grew by 0.4% MoM in September, recovering from August’s 0.1% and beating median market forecasts of a 0.3% print. Retail Sales excluding Automotive spending also thumped forecasts, growing by 0.5% in September compared to the expected 0.1%, and easily vaulting over August’s 0.2% increase.
US Initial Jobless Claims for the week ended October 11 also beat market expectations, coming in at 241K for the week. Investors expected the week’s new jobless claimant count to hold steady at the previous week’s revised 260K.
Silicon manufacturers and chip-punchers are getting dragged higher across the board on Thursday. Nvidia (NVDA) was propelled into another all-time high on Thursday, climbing over 3%. The Taiwan Semiconductor Manufacturing Company, a key supplier in the tech sphere, announced stronger-than-expected Q3 earnings and raised 4Q revenue forecasts. The upbeat earnings call assuaged market fears that the AI boom might be fizzling out, even as large-scale predictive data-modeling projects continue to struggle with figuring out how to generate revenue from their projects.
Dow Jones news
Despite nearly half of the Dow Jones index trading cautiously in the red on Thursday, firm gains in key stocks are raising the overall equities board. Intel (INTC) rose 1.6% in a knock-on tech rally, rising above $22.50 per share as the struggling chipmaker battles back from a multi-year low.
Travelers Companies (TRV) surged 8% on Thursday, climbing above $262 per share after the insurer reported stronger-than-expected Q3 earnings. Revenues climbed QoQ when markets were broadly anticipating a slight decline. CEO Alan Schnitzer credited the company’s “stellar underwriting performance” to a net increase in earned premiums and an overall reduction in insurance payouts.
Dow Jones price forecast
The Dow Jones continues to grind out chart paper on the high end, clipping new all-time highs above 43,250 and extending 2024’s bull run to nearly 15%. Bullish momentum is once again outrunning long-term averages, with the 200-day Exponential Moving Average (EMA) rising through 39,500 and struggling to catch up.
Price action has firmly tilted into the overbought end, spelling trouble for traders looking for smooth sailing. While short-term traders will no doubt be looking for a downside snap back to median prices before reloading into another leg higher, there’s little reason for investors who are already heavily long to pull out now.
Dow Jones daily chart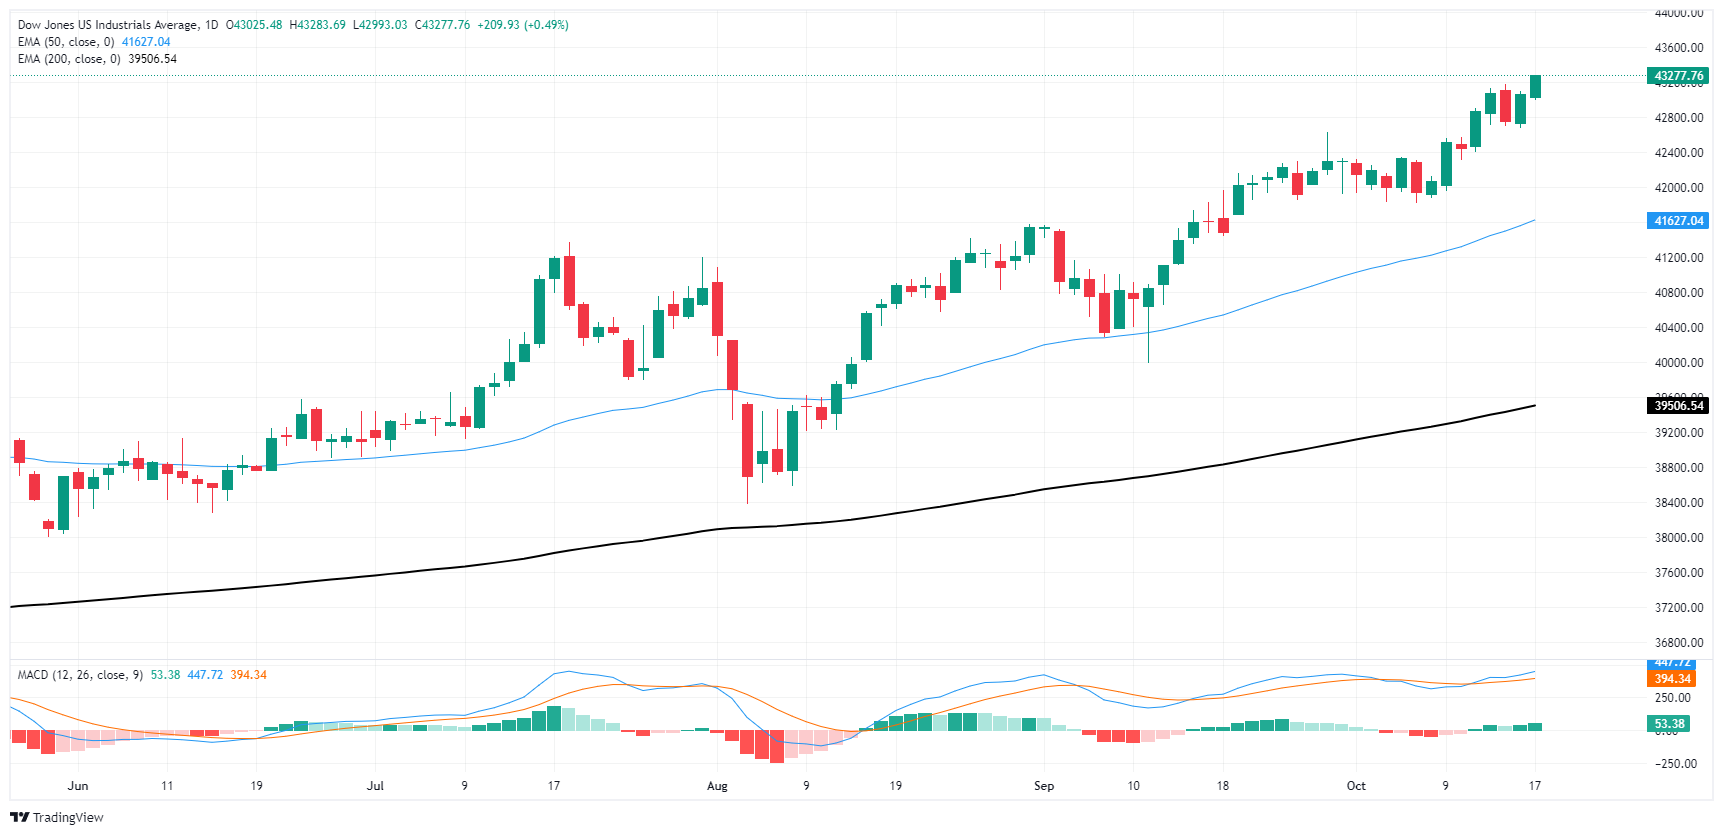
Economic Indicator
Initial Jobless Claims
The Initial Jobless Claims released by the US Department of Labor is a measure of the number of people filing first-time claims for state unemployment insurance. A larger-than-expected number indicates weakness in the US labor market, reflects negatively on the US economy, and is negative for the US Dollar (USD). On the other hand, a decreasing number should be taken as bullish for the USD.
Read more.Last release: Thu Oct 17, 2024 12:30
Frequency: Weekly
Actual: 241K
Consensus: 260K
Previous: 258K
Source: US Department of Labor
Every Thursday, the US Department of Labor publishes the number of previous week’s initial claims for unemployment benefits in the US. Since this reading could be highly volatile, investors may pay closer attention to the four-week average. A downtrend is seen as a sign of an improving labour market and could have a positive impact on the USD’s performance against its rivals and vice versa.
Author

Joshua Gibson
FXStreet
Joshua joins the FXStreet team as an Economics and Finance double major from Vancouver Island University with twelve years' experience as an independent trader focusing on technical analysis.


![Hyperliquid representatives, Trade[XYZ] meet SEC Crypto Task Force to discuss digital asset regulation](https://editorial.fxsstatic.com/images/i/Hyperliquid_Bull.png)


