$DIS (Walt Disney): The stock is trading within buying area

Disney has been in a tremendous decline since it peaked at $203.02 back 03.08.2021. The Peak ended a Grand Super Cycle and since then it has corrected in larger pullback. The Elliott Wave Theory provides us with cycle degrees determined by the time each cycle lasts. So the Grand Super Cycle is the highest cycle degree and can sometimes last even centuries. Here is the page that explains all the details within the Theory and provides new traders with enough guidelines to navigate the market. Let’s take a look at the Elliott Wave outlook for Disney.
Disney ($DIS) monthly Elliott Wave chart
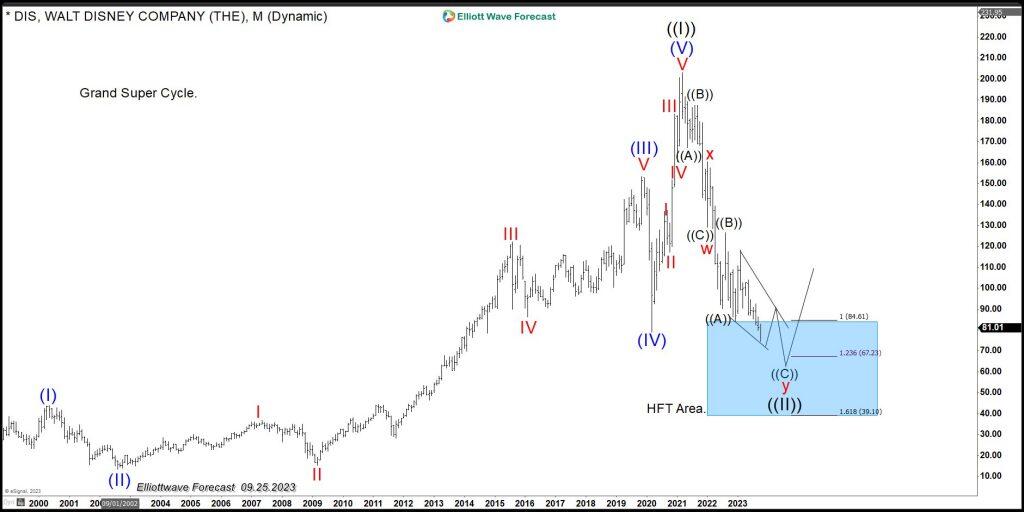
The chart above is the representation of the Grand Super Cycle and clearly shows a five-wave advance in the Blue degree which ended wave ((I)) Grand Super Cycle. The idea of the five waves means overall that three waves of pullback are next to happen based on the Elliott Wave Theory. Sure enough $DIS have then seen a tremendous decline in wave ((II)) in Grand Super Cycle degree. The symbol has reached the minimum distance within the decline and has reached the buying area. The Elliott Wave Theory primary pattern states that the market moves in five waves in each cycle, then three waves pullback. Afterwards, a continuation higher in the direction of the previous five waves. This is a straightforward behavior that repeats itself time after time.
Impulse Elliott Wave structure
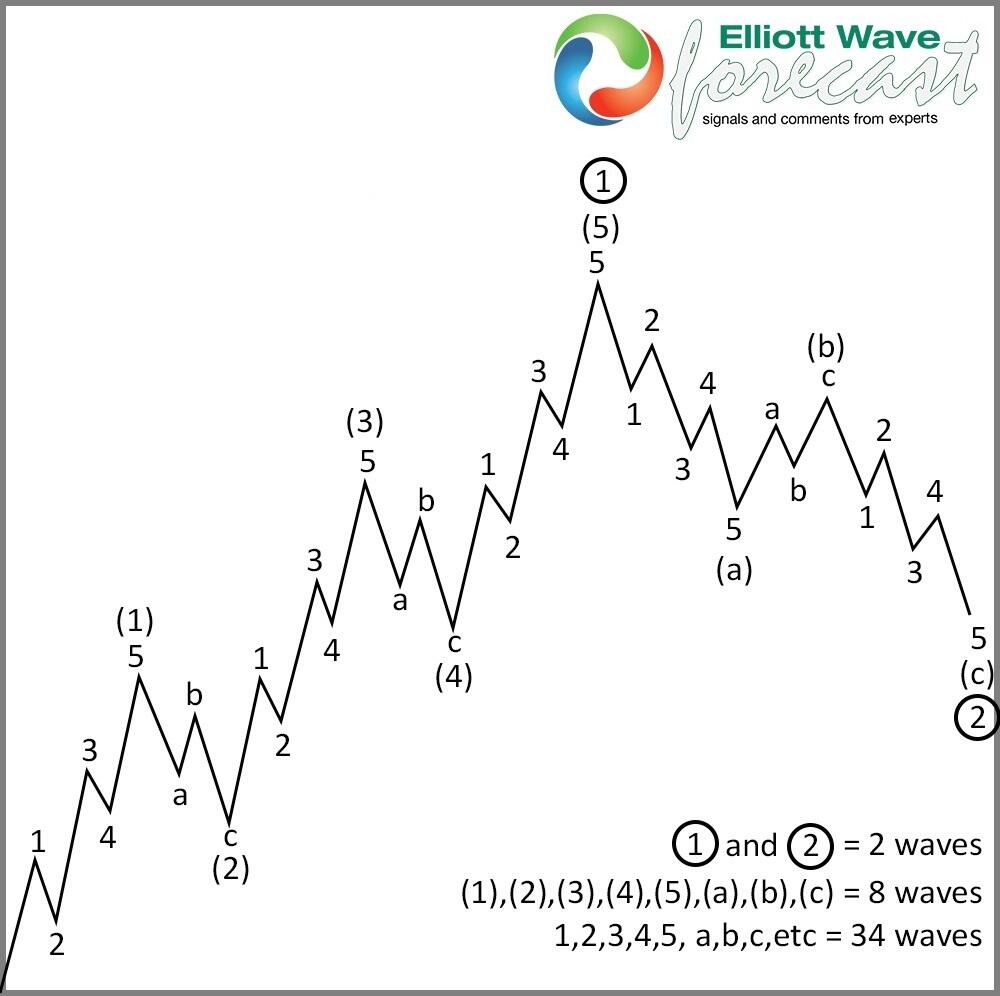
The graph above shows the five waves advance and the three waves pullback. It looks similar compared to the $DIS Monthly chart. Analyzing the charts of Disney within the Grand Super Cycle makes it easy to understand this decline. It is a great and unique opportunity to buy the stock and hold it for a long time.
$DIS weekly Elliott Wave chart
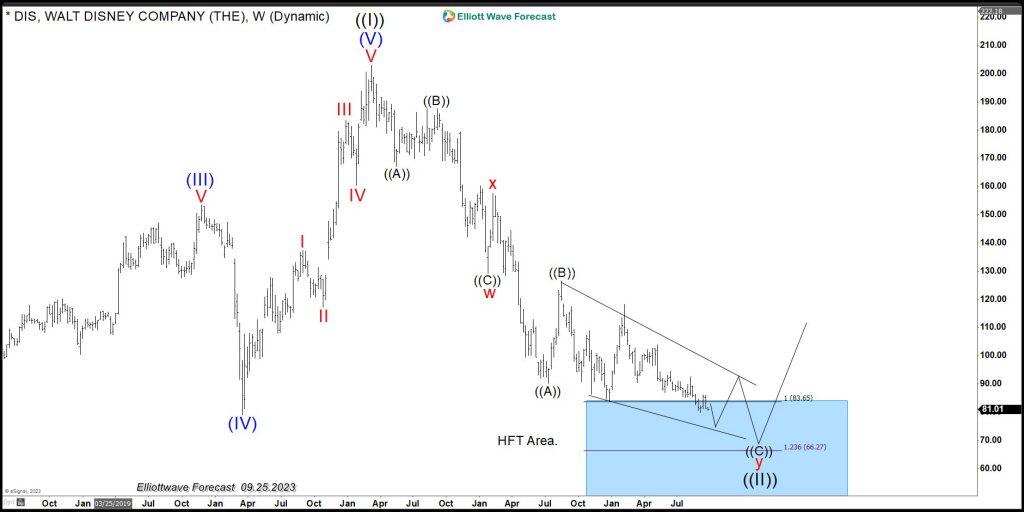
Zooming in on the Weekly chart above, we see how the decline unfolds in a WXY. It is a seven-swing structure which consists of 2 ABC combination. Hence, the market follows a sequence of 5-3-5-3-5-3-5. It should end around 1.00-1.618% of W related to X. At this moment, we are trading within the area, which is represented with the blue box. As seen from the char above, down from wave ((1)), the stock did three waves lower or an ABC, which ended around 01.01.2022. The stock then bounced in wave X and then entered another leg lower. Right now it is trading within the Blue Box area or the 1.00-1.618% Fibonacci extension.
WXY double three structure
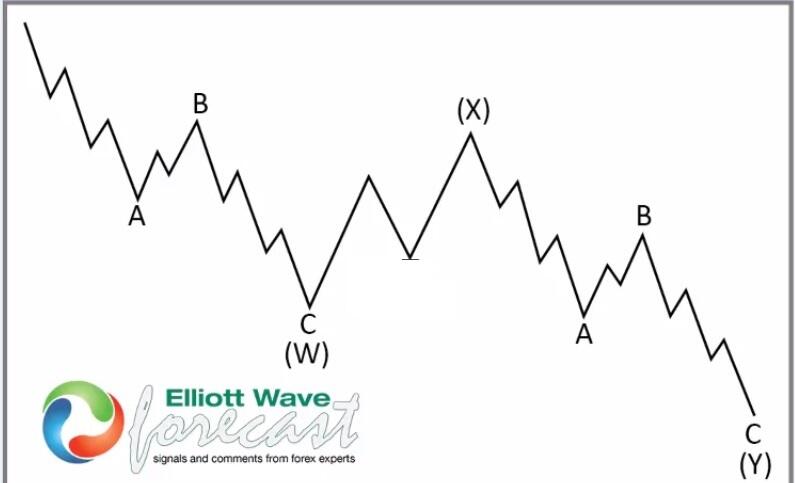
The graph above shows how a WXY looks in the Theory. Comparing this to the Weekly chart of Disney, it is fair to say they look alike. Soon Disney will start a new cycle higher and provide investors with an excellent opportunity to ride a very good long position. The Market follows patterns, and the Elliott Wave Theory helps us to identify them and take chances in favor of the trend.
Premium
You have reached your limit of 3 free articles for this month.
Start your subscription and get access to all our original articles.
Author

Elliott Wave Forecast Team
ElliottWave-Forecast.com


