Defense stocks gain renewed focus on Russia-Ukraine conflict: Stock forecast on GD, LTM, RTX, NOC, BAESY
- Russian invasion of Ukraine has depressed most major stock market sectors.
- Defense stocks are an outlier due to Western governments' increased military investments.
- Germany has decided to increase its defense spending to 2% of GDP two years ahead of schedule.

The US stock market has had a dismal start to 2022. Every sector, save energy, has lost ground year to date. The defense industry, however, remains an island in this sea of red. Already up for the year, Russia's invasion of Ukraine on February 24 has triggered a massive jump in defense stocks after formerly neutral and relaxed European nations have announced a number of new investments in their militaries.
German Chancellor Olaf Scholz announced this past Sunday that Germany would immediately raise its defense budget to above 2% of GDP, a prior agreement level made with NATO countries that was not due until 2024. Scholz has already ended his nation's post-WWII consensus on sending military hardware to active war zones. After getting hectored for sending combat helmets to Ukraine before the conflict began, Scholz has reversed course and given 500 Stinger missiles and more than 1,000 anti-tank weapons to the country. Now, he is preparing to spend an additional 100 billion euros in new military purchases.
Before the war even began, Russia had been staging forces on the border with Ukraine. Poland already sent a request to the US Congress on February 17 to buy over $6 billion worth of equipment. In particular, Poland asked to buy 250 tanks from General Dynamics (GD), 26 combat recovery tanks from BAE Systems (BAESY), as well as smaller contracts with Raytheon Technologies (RTX) and Lockheed Martin (LMT).
Both Sweden and Switzerland, hardcore neutral nations, have thrown off their prior stance. Sweden has sent anti-tank weapons, and Switzerland has said it would vote with the European Union for financial sanctions again Russia.
With all this renewed interest in buying military hardware, it is no wonder that the S&P 500 Aerospace & Defense Index ETF (XAR) is booming. Shares are up more than 12% at the same time that most sectors are down. The S&P 500 (SPX) is down -3.4% over the same period.
Read below for further specifics on five major defense contractors benefitting from the new focus on military spending. In each case, FXStreet shows the Fibonacci extension levels that may come in handy in order to take profit.
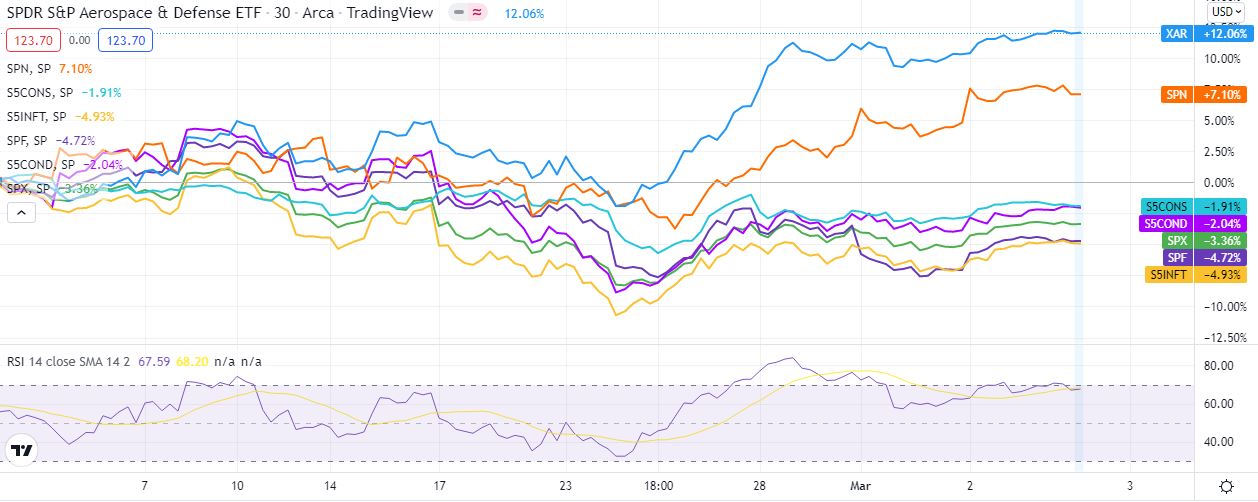
SPRD Aerospace & Defense ETF vs. other sectors over 1 month
General Dynamics Stock Forecast: GD ready for a pullback
General Dynamics (GD) seems to have halted near the 161.8% Fibonacci level at $235.21. GD stock has already developed short-term support at $229.16, which stems from the past three sessions. Shares are bullish above $235.21 and bearish below $229.16. The Relative Strength Index (RSI) is hovering just a hair below 80, which makes it strongly overbought and possibly ready for a reversal. If so, further support rides on the 20-day moving average at $217.88. If General Dynamics shares remain bid, then it could trend up to the 261.8% Fibo at $250.77.
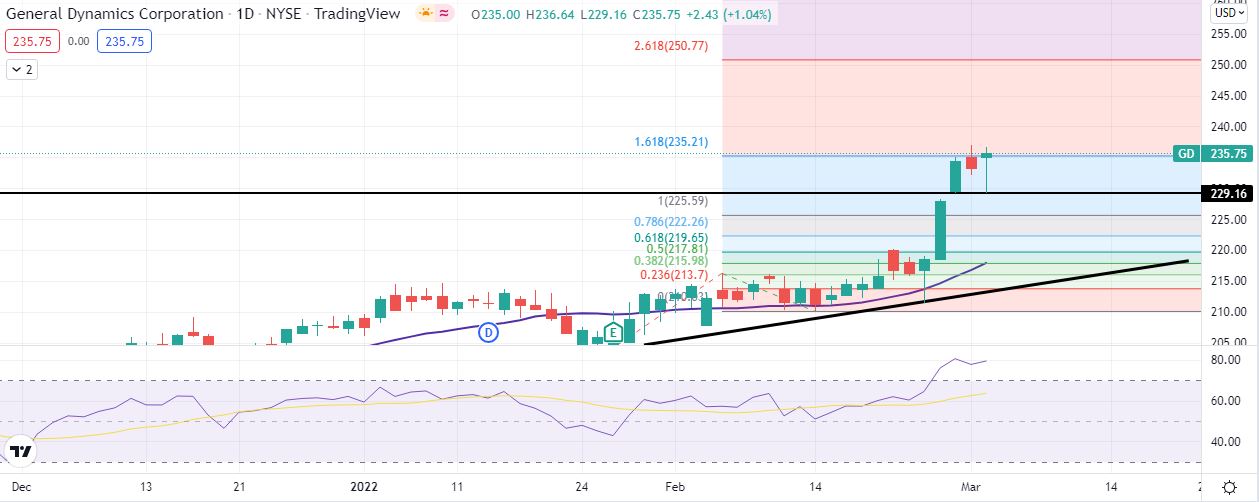
GD 1-day chart
Lockheed Martin Stock Forecast: $484.19 serves as next target for LMT
Lockheed Martin stock is trending than many of its peers. LMT shares rose more than 5% on both Monday and Tuesday of this week before a slight pullback on Wednesday. The most recent session saw the stock draw down all the way to the 78.6% Fibonacci level at $429.75. If the stock remains in sync with the Fibo chart, then the 161.8% Fibo at $484.19 may be the next target.
$429.75 may serve as further support, but strong support sits at the 9-day moving average at $411.01, which coincides with the midpoint on the Fibo extension chart.
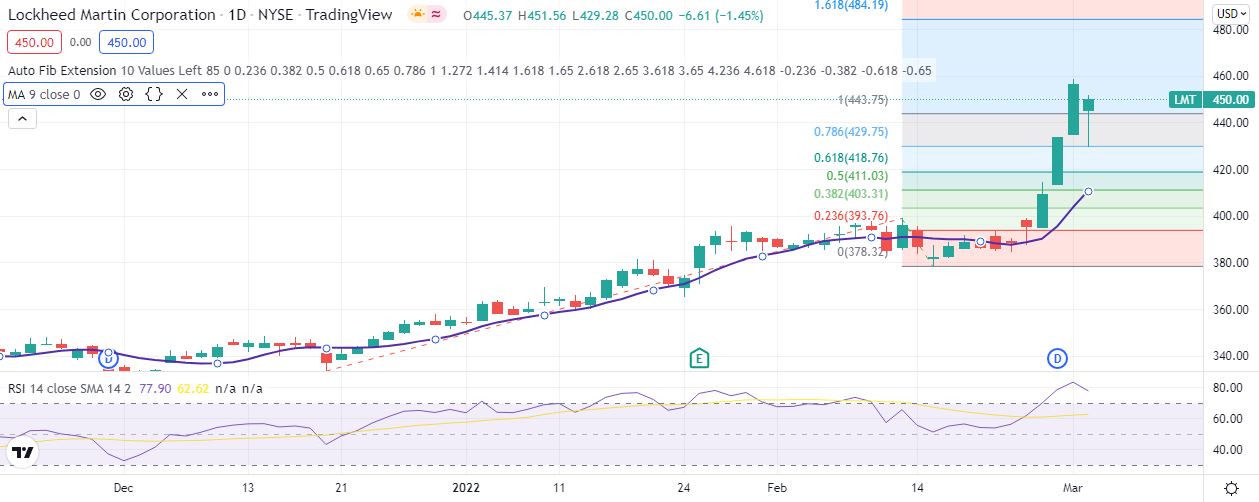
LMT 1-day chart
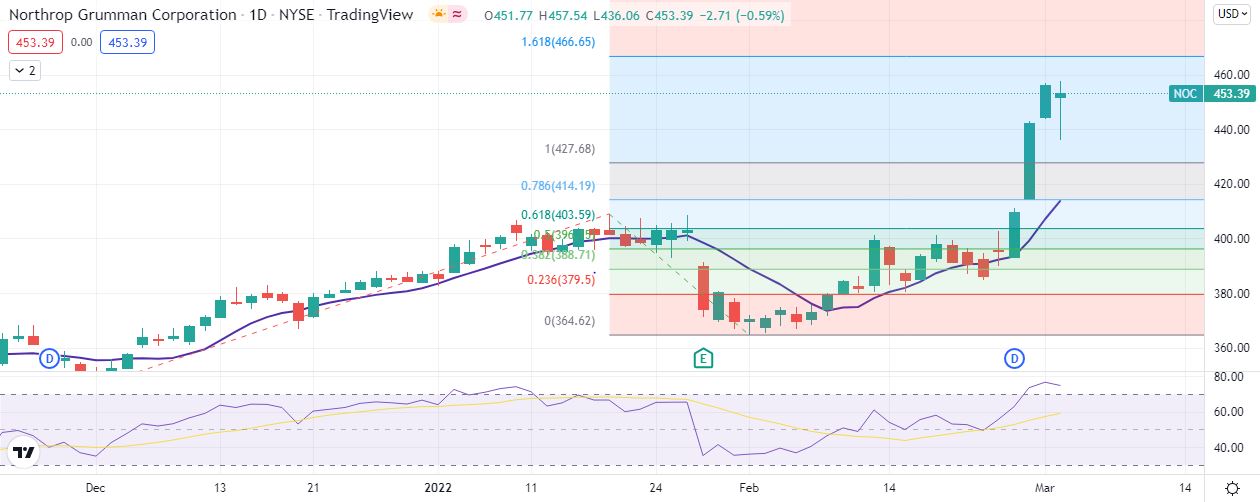
Northrop Grumman Stock Forecast: NOC targeting $466.65
Northrop Grumman, one of the biggest defense stocks by market cap, was dealt an early pullback on Wednesday before rallying late in the day to make it back near Tuesday's close. The long bottom wick on Wednesday's candle shows there is plenty of room left to run.
Support is found once again at the 9-day moving average, which coincides almost perfectly with the 78.6% Fibo. On the upside, continued positive news of new contracts signed with more NATO governments should help NOC stock ride up to $466.65, the 161.8% Fibo extension.
Raytheon Technologies Stock Forecast: Shooting star pattern forecasts RTX reversal
Raytheon stock has developed the most interesting candlestick pattern of the bunch. A shooting star of sorts formed on Tuesday with the subsequent red candle in the following session. This is a bearish pattern. RTX stock may be less likely to outperform in this bullish climate, at least as much as its peers, since it is valued so much higher than them. RTX sports a 40 price-to-earnings ratio, whereas Northrop Grumman trades for just 10 times earnings. Lockheed Martin and General Dynamics trade for around 20.
If it does retrace its steps, RTX is most likely to circle back to $95.41, near where the 20-day moving average sits currently. Additionally, the trendline connecting the higher lows would offer another means of support in between $90 and $92. The 78.6% Fibo at $94.85 is just below and provides further significance to this region. The upside moves would target the 161.8% and 262.8% Fibo extensions at $105.49 and $118.28, respectively.
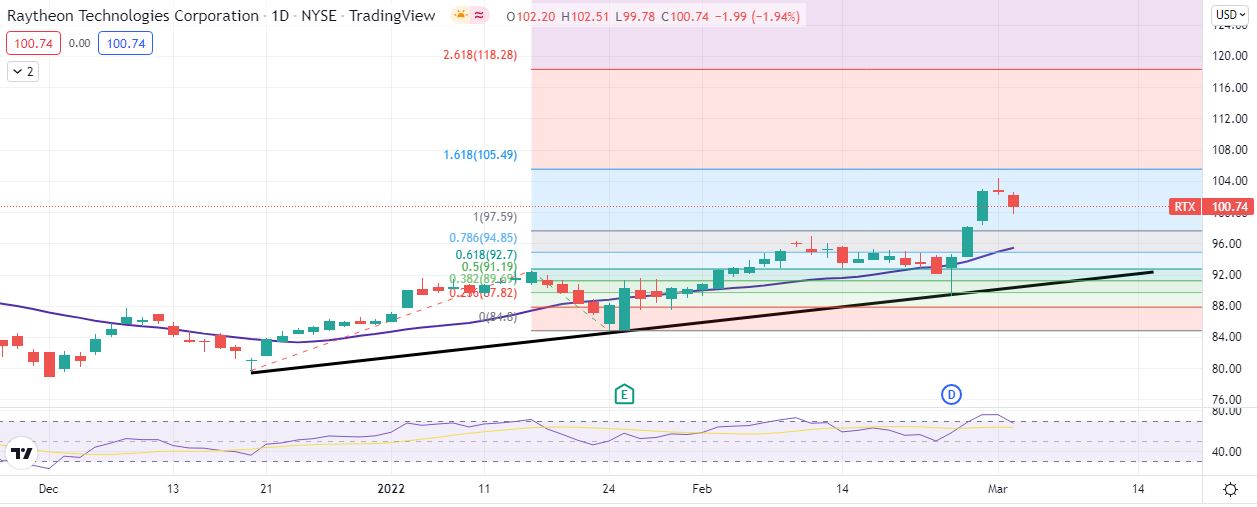
RTX 1-day chart
BAE Systems Stock Forecast: BAESY ready for a retracement
BAE Systems stock has a peculiar chart. Each of the past three sessions ended lower than where it opened though at prices much higher than last week. This makes it appear that the stock has crested somewhat. Also, the stock has hit the 80s on the RSI over the past three sessions, so it appears the British defense powerhouse is overbought and ready for a pullback. Support sits at $36.10 and $34.14, both Fibo retracement levels. The 361.8% and the 423.6% Fibo extensions at $40.81 and $42.26 are BAESY's upside targets.
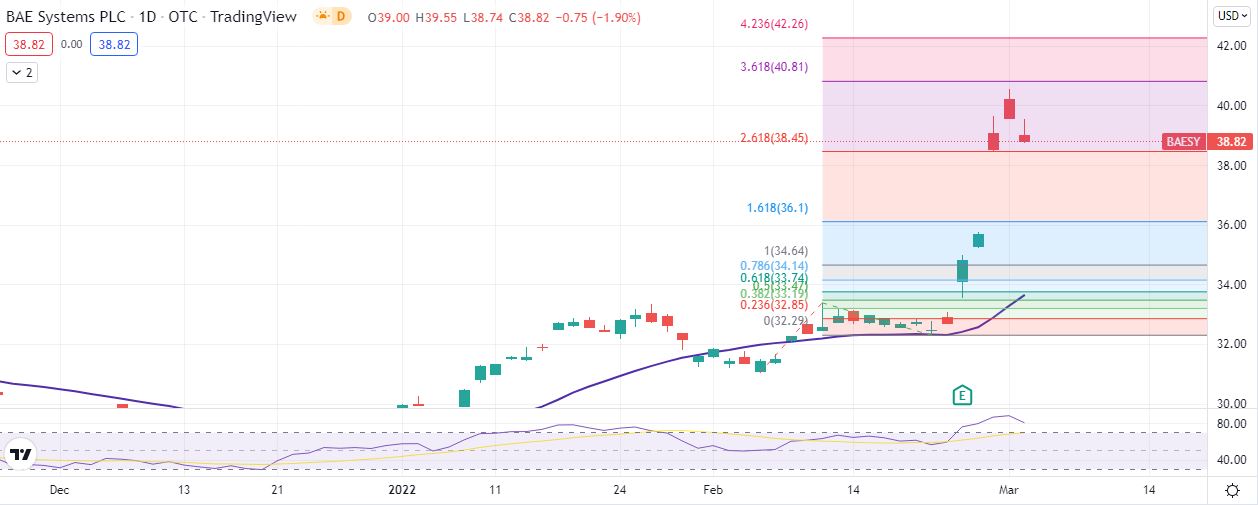
BAESY 1-day chart
Like this article? Help us with some feedback by answering this survey:
Premium
You have reached your limit of 3 free articles for this month.
Start your subscription and get access to all our original articles.
Author

Clay Webster
FXStreet
Clay Webster grew up in the US outside Buffalo, New York and Lancaster, Pennsylvania. He began investing after college following the 2008 financial crisis.


