Crude Oil in good shape to close off this Thursday in the green
- Crude Oil remains facing pressure as the IEA report adds to the bearish outlook.
- The monthly report from the IEA had no change on the narrative for the 2025 outlook.
- The US Dollar Index sees rally fade after US PPI numbers came in a touch stronger than expected.

Crude Oil steadies and consolidates recent losses after the International Energy Agency (IEA) released its monthly report for November on Thursday. The IEA follows the Organization of the Petroleum Exporting Countries (OPEC) outlook released earlier this week and has revised down its 2025 Oil demand forecast. Another downside revision adds more conviction to a bearish outlook on Oil prices in the long term.
The US Dollar Index (DXY), which tracks the performance of the Greenback against six other currencies, extended gains and reached a fresh year-to-date high above 107.00 ahead of the US trading session.
In the economic data front, the US Producer Price Index (PPI) for October came in a touch stronger than expected on Thursday, after the US Consumer Price Index (CPI) released on Wednesday fell broadly in line with expectations. All eyes will be on the Federal Reserve (Fed) Chairman Jerome Powell speech, scheduled at 20:00 GMT, with traders looking for clues on the December interest rate cut.
At the time of writing, Crude Oil (WTI) trades at $68.74 and Brent Crude at $72.57
Oil news and market movers: EIA data already priced in for a build up
- A privately owned Chinese refiner bought West African crude in a rare purchase. Normally, independent processors in China tend to favor imports from Iran and Russia, Bloomberg reports.
- Non-OPEC capacity will be boosted by new offshore conventional projects. Projects in Brazil, Guyana, and Norway are set to add to the already oversupplied market, according to the IEA's monthly Oil Market Report.
- In its report, the IEA lifted its forecast for this year's oil-demand growth but slightly trimmed next year's estimates, citing the impact of China's economic slowdown on consumption, Bloomberg reports.
- The US Energy Information Administration (EIA) will release its weekly Crude Oil price changes at 16:00 GMT. Expectation is for a build of 1.86 million barrels against the previous build of 2.149 million barrels last week.
Oil Technical Analysis: Limited upside
Crude Oil price is starting to show the pattern that precedes a breakout, with lower highs and higher lows. A breakout looks imminent from a purely technical point of view. With all these bearish elements taken into account, a break to the downside seems rather plausible than a pop to the upside.
On the upside, the 55-day Simple Moving Average (SMA) at $70.25 is the first barrier to consider before the hefty technical level at $73.58, with the 100-day Simple Moving Average (SMA). The 200-day SMA at $76.68 is still quite far off, although it could get tested in case tensions in the Middle East arise.
On the other side, traders need to look towards $67.12 – a level that held the price in May and June 2023 – to find the first support. In case that level breaks, the 2024 year-to-date low emerges at $64.75, followed by $64.38, the low from 2023.
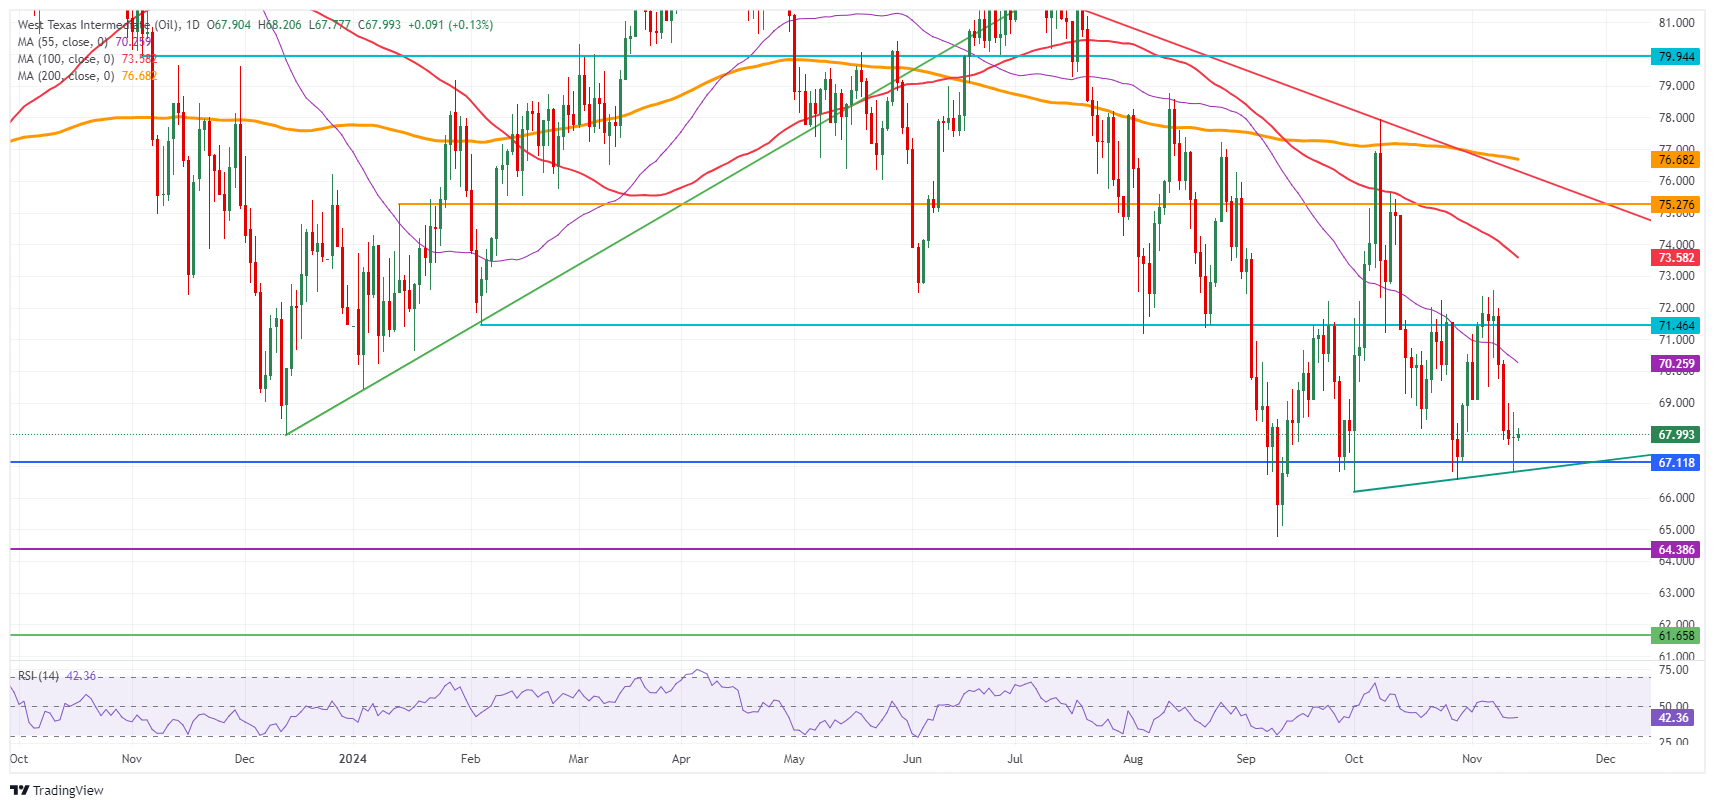
US WTI Crude Oil: Daily Chart
WTI Oil FAQs
WTI Oil is a type of Crude Oil sold on international markets. The WTI stands for West Texas Intermediate, one of three major types including Brent and Dubai Crude. WTI is also referred to as “light” and “sweet” because of its relatively low gravity and sulfur content respectively. It is considered a high quality Oil that is easily refined. It is sourced in the United States and distributed via the Cushing hub, which is considered “The Pipeline Crossroads of the World”. It is a benchmark for the Oil market and WTI price is frequently quoted in the media.
Like all assets, supply and demand are the key drivers of WTI Oil price. As such, global growth can be a driver of increased demand and vice versa for weak global growth. Political instability, wars, and sanctions can disrupt supply and impact prices. The decisions of OPEC, a group of major Oil-producing countries, is another key driver of price. The value of the US Dollar influences the price of WTI Crude Oil, since Oil is predominantly traded in US Dollars, thus a weaker US Dollar can make Oil more affordable and vice versa.
The weekly Oil inventory reports published by the American Petroleum Institute (API) and the Energy Information Agency (EIA) impact the price of WTI Oil. Changes in inventories reflect fluctuating supply and demand. If the data shows a drop in inventories it can indicate increased demand, pushing up Oil price. Higher inventories can reflect increased supply, pushing down prices. API’s report is published every Tuesday and EIA’s the day after. Their results are usually similar, falling within 1% of each other 75% of the time. The EIA data is considered more reliable, since it is a government agency.
OPEC (Organization of the Petroleum Exporting Countries) is a group of 12 Oil-producing nations who collectively decide production quotas for member countries at twice-yearly meetings. Their decisions often impact WTI Oil prices. When OPEC decides to lower quotas, it can tighten supply, pushing up Oil prices. When OPEC increases production, it has the opposite effect. OPEC+ refers to an expanded group that includes ten extra non-OPEC members, the most notable of which is Russia.
Author

Filip Lagaart
FXStreet
Filip Lagaart is a former sales/trader with over 15 years of financial markets expertise under its belt.