Crude Oil struggles to recover footing on Tuesday despite API barrel count contraction
- WTI US Crude Oil found a foothold above $77.00, but bearish pressure remains.
- Crude Oil markets have fallen back as geopolitical risk premiums get priced out.
- Uncertainty in Chinese fossil fuel demand keeps barrel prices pinned low.

West Texas Intermediate (WTI) briefly fell below $77.00 per barrel on Tuesday before a meager recovery that left US Crude Oil markets grappling with a fresh bout of broad-market bearishness.
The American Petroleum Institute (API) noted on Tuesday that its week-on-week Crude Oil Stocks counts contracted again by a further 3.9 million barrels, adding onto the previous week’s -4.44 million barrel decline. The API’s weekly barrel counts contracted even further than the expected -2.47 million barrel contraction as US supplies continue to draw down. The API’s weekly stock counts helped to bolster WTI bids in the late US market session, but overall price momentum remains sluggish and tilted toward the downside.
An increase in Chinese demand for Crude Oil, which was broadly leaned on in the first half of the year in order to prop up barrel bids, has given way to fears of a lopsided Chinese economy in the face of declines in global growth figures. With hopes of a broad recovery in Chinese fuel demand going up in smoke, markets are finding little reason to keep supporting Crude Oil prices as geopolitical tensions in the Middle East continue to sizzle with no foreseeable impact after months of concerns about a possible crimp in global Crude Oil production.
WTI technical outlook
WTI has found a foothold after plunging towards $76.25 on Tuesday, but a bullish bounce failed to recover above the last swing low into $77.50. Intraday price action is leaning into the bearish side, though near-term momentum may have run its course and allow an elastic snap back to the 200-hour Exponential Moving Average (EMA) at $79.80.
Daily candlesticks paint a notable bearish picture, with US Crude Oil prices threatening to backslide to early June’s bottom bids near $72.50 and price action descending almost unimpeded below the 200-day EMA at $79.23.
WTI hourly chart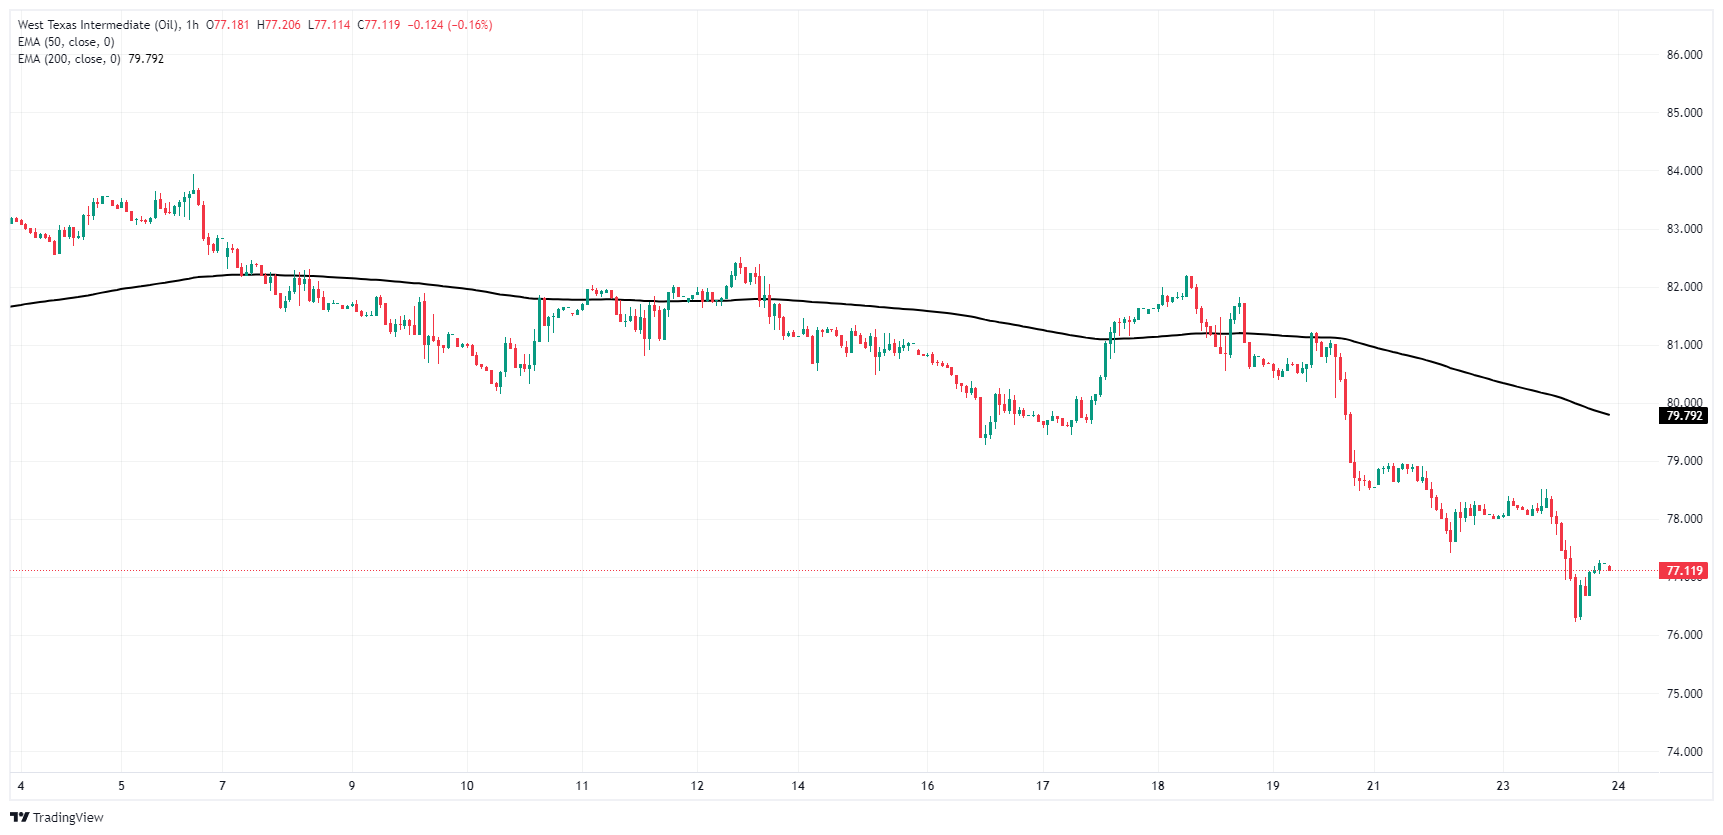
WTI daily chart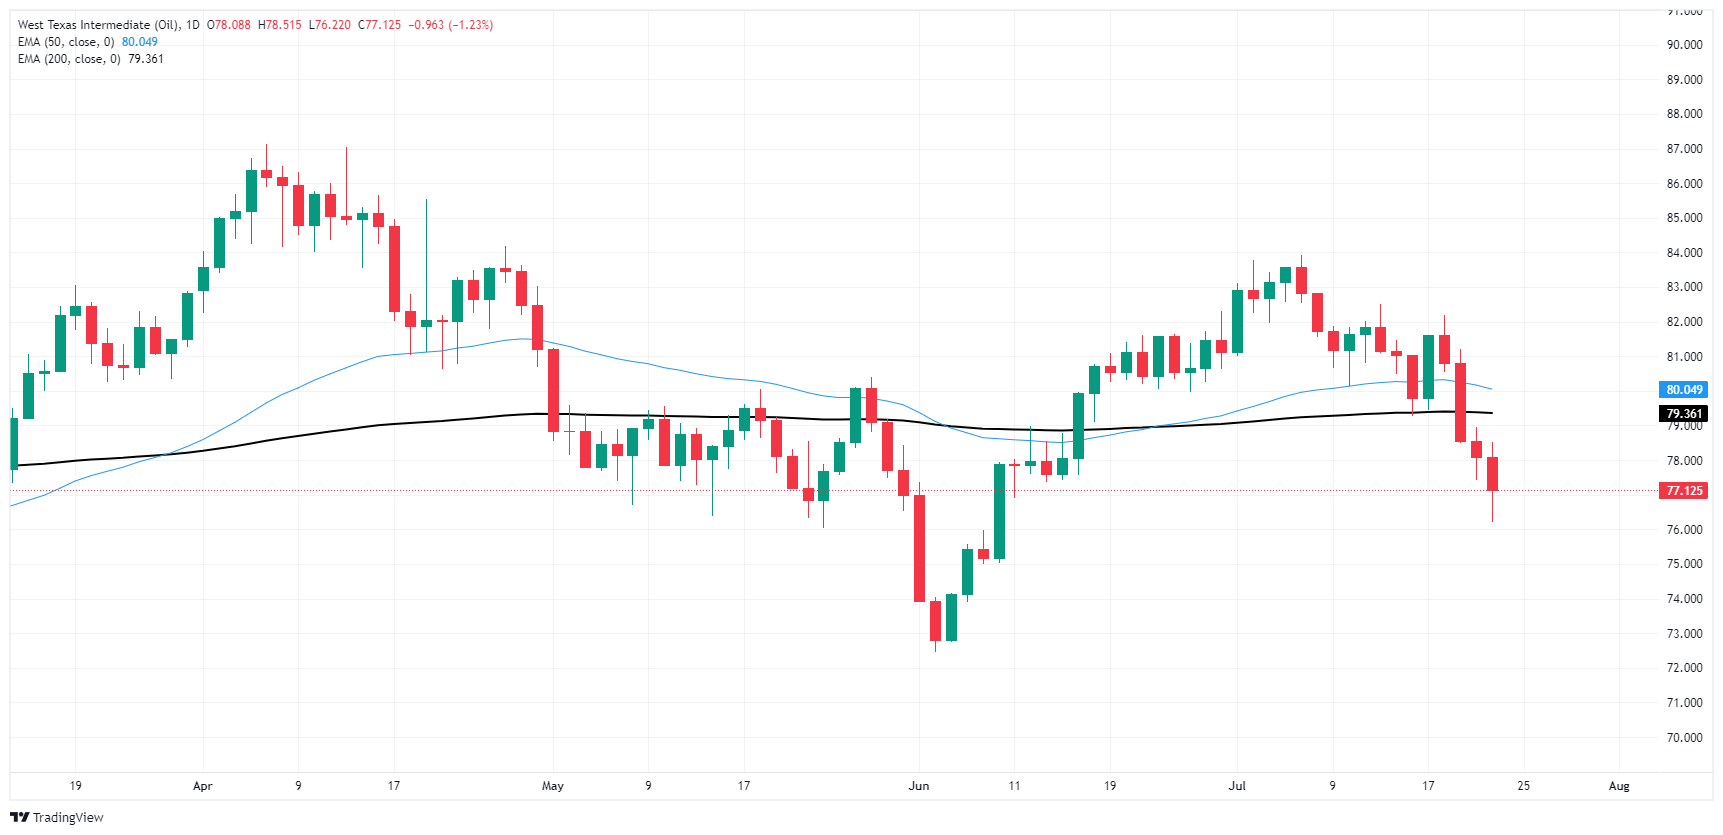
WTI Oil FAQs
WTI Oil is a type of Crude Oil sold on international markets. The WTI stands for West Texas Intermediate, one of three major types including Brent and Dubai Crude. WTI is also referred to as “light” and “sweet” because of its relatively low gravity and sulfur content respectively. It is considered a high quality Oil that is easily refined. It is sourced in the United States and distributed via the Cushing hub, which is considered “The Pipeline Crossroads of the World”. It is a benchmark for the Oil market and WTI price is frequently quoted in the media.
Like all assets, supply and demand are the key drivers of WTI Oil price. As such, global growth can be a driver of increased demand and vice versa for weak global growth. Political instability, wars, and sanctions can disrupt supply and impact prices. The decisions of OPEC, a group of major Oil-producing countries, is another key driver of price. The value of the US Dollar influences the price of WTI Crude Oil, since Oil is predominantly traded in US Dollars, thus a weaker US Dollar can make Oil more affordable and vice versa.
The weekly Oil inventory reports published by the American Petroleum Institute (API) and the Energy Information Agency (EIA) impact the price of WTI Oil. Changes in inventories reflect fluctuating supply and demand. If the data shows a drop in inventories it can indicate increased demand, pushing up Oil price. Higher inventories can reflect increased supply, pushing down prices. API’s report is published every Tuesday and EIA’s the day after. Their results are usually similar, falling within 1% of each other 75% of the time. The EIA data is considered more reliable, since it is a government agency.
OPEC (Organization of the Petroleum Exporting Countries) is a group of 13 Oil-producing nations who collectively decide production quotas for member countries at twice-yearly meetings. Their decisions often impact WTI Oil prices. When OPEC decides to lower quotas, it can tighten supply, pushing up Oil prices. When OPEC increases production, it has the opposite effect. OPEC+ refers to an expanded group that includes ten extra non-OPEC members, the most notable of which is Russia.
Author

Joshua Gibson
FXStreet
Joshua joins the FXStreet team as an Economics and Finance double major from Vancouver Island University with twelve years' experience as an independent trader focusing on technical analysis.


