Crude Oil attempts to go beyond $70.00 despite IMF’s bearish outlook
- Crude Oil struggles to uphold $70.00 for more than day, with more downside expected.
- Traders expect longer sluggish demand as markets reprice Fed rate cut prospects.
- The US Dollar Index broke above 103.80 and tested 104.00, primed for more upside.

Crude Oil struggles to hold ground and orbits around the $70.00 level on Tuesday. The pressure on Oil’s price comes from markets repricing the US Federal Reserve (Fed) interest rate cut projections in the near future. With decreasing odds of an aggressive rate cut path by the Fed, economic growth and energy demand might be killed, which means a bleak outlook for Oil in the coming months.
The US Dollar Index (DXY), which tracks the performance of the Greenback against six other currencies, consolidates near an 11-week high of 104.00 on Tuesday. With the surge in US yields, the rate differential sees the US overshadow other main continents, such as Europe or Asia. This supports the DXY, which may rise further in the coming weeks to 105.00.
At the time of writing, Crude Oil (WTI) trades at $71.71 and Brent Crude at $74.79
Oil news and market movers: Where is the growth?
- Money managers have cut their net-long speculative positions in ICE Brent futures for the first time in five weeks, Bloomberg reports.
- Additionally, the Chicago Futures Trading Commission (CFTC) reported that WTI Crude futures saw their net-long position fall for a third week in a row, Bloomberg reported.
- Norway rose its Oil output in September, up 1.5% above its forecast, Reuters reports.
- At 20:30 GMT, the American Petroleum Institute (API) will release the weekly Crude Stockpile Change data for the week ending October 18. There is no forecast, with a small draw of 1.58 million barrels seen the prior week.
Oil Technical Analysis: Plenty of Oil to go qround
Crude Oil price is facing more and more pressure to trade at more discount. Markets are stripping away geopolitics in the Middle East, with nearly all external parties not willing to get involved in a proxy war, while Israel and Iran are escalating tensions at a very slow pace. While supply is richly flowing, the markets look flooded with Oil for the rest of 2024, according to the recent Energy Information Administration (EIA) report.
There is a challenging path to recovery for Crude Oil in the coming days. First, the pivotal level at $71.46, which was strong enough to catch the falling knife on October 14, must be regained again with a daily close above it. Once from there, the hefty technical level at $75.13, with the 100-day Simple Moving Average (SMA) and a few pivotal lines, is possibly the first big hurdle ahead.
On the downside, traders need to look much lower, at $67.12, a level that supported the price in May-June 2023. In case that level breaks, the 2024 year-to-date low emerges at $64.75 followed by $64.38, the low of 2023.
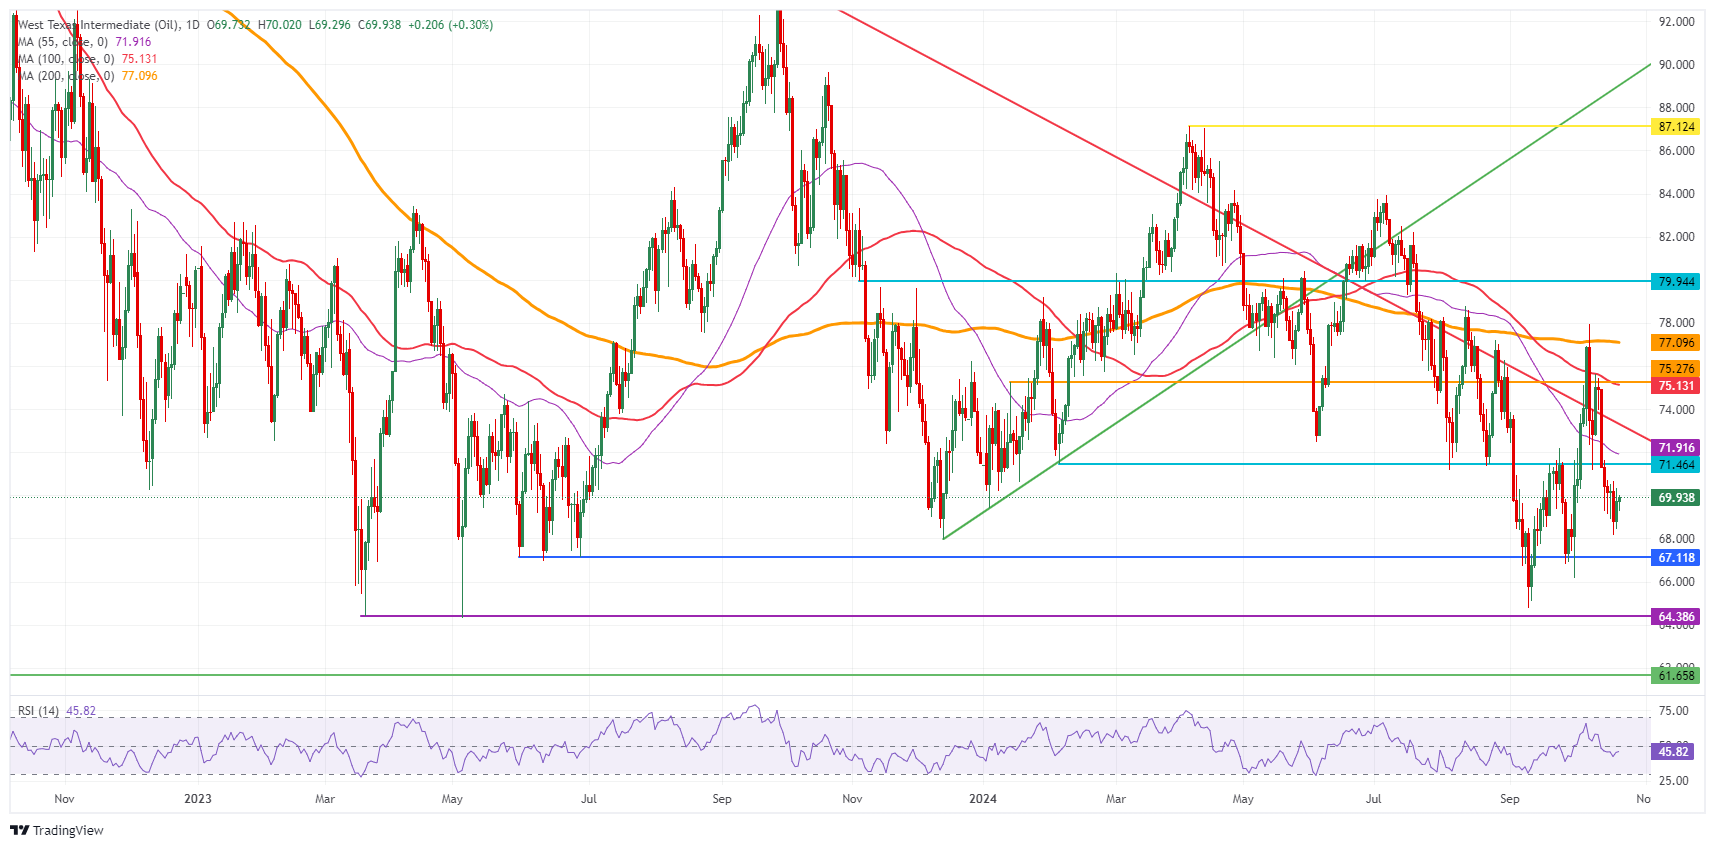
US WTI Crude Oil: Daily Chart
WTI Oil FAQs
WTI Oil is a type of Crude Oil sold on international markets. The WTI stands for West Texas Intermediate, one of three major types including Brent and Dubai Crude. WTI is also referred to as “light” and “sweet” because of its relatively low gravity and sulfur content respectively. It is considered a high quality Oil that is easily refined. It is sourced in the United States and distributed via the Cushing hub, which is considered “The Pipeline Crossroads of the World”. It is a benchmark for the Oil market and WTI price is frequently quoted in the media.
Like all assets, supply and demand are the key drivers of WTI Oil price. As such, global growth can be a driver of increased demand and vice versa for weak global growth. Political instability, wars, and sanctions can disrupt supply and impact prices. The decisions of OPEC, a group of major Oil-producing countries, is another key driver of price. The value of the US Dollar influences the price of WTI Crude Oil, since Oil is predominantly traded in US Dollars, thus a weaker US Dollar can make Oil more affordable and vice versa.
The weekly Oil inventory reports published by the American Petroleum Institute (API) and the Energy Information Agency (EIA) impact the price of WTI Oil. Changes in inventories reflect fluctuating supply and demand. If the data shows a drop in inventories it can indicate increased demand, pushing up Oil price. Higher inventories can reflect increased supply, pushing down prices. API’s report is published every Tuesday and EIA’s the day after. Their results are usually similar, falling within 1% of each other 75% of the time. The EIA data is considered more reliable, since it is a government agency.
OPEC (Organization of the Petroleum Exporting Countries) is a group of 12 Oil-producing nations who collectively decide production quotas for member countries at twice-yearly meetings. Their decisions often impact WTI Oil prices. When OPEC decides to lower quotas, it can tighten supply, pushing up Oil prices. When OPEC increases production, it has the opposite effect. OPEC+ refers to an expanded group that includes ten extra non-OPEC members, the most notable of which is Russia.
Author

Filip Lagaart
FXStreet
Filip Lagaart is a former sales/trader with over 15 years of financial markets expertise under its belt.


