Crude Oil roils on Wednesday after EIA prints another weekly buildup in US Crude Oil Stocks
- WTI eased to $80.00 per barrel on Wednesday, continues to churn in a rough range.
- EIA Crude Oil counts reported another week-on-week buildup of US barrel supplies.
- Energy markets continue to hope for a demand upswell to materialize in summer.

West Texas Intermediate (WTI) US Crude Oil tumbled back to $80.00 per barrel on Wednesday after the Energy Information Administration (EIA) reported another unexpected increase in week-on-week US Crude Oil Stocks Change, kicking the legs out from beneath barrel traders that were hoping for a net decrease in US Crude Oil supplies.
According to the EIA, US Crude Oil Stocks Change piled on an additional 3.591 million barrels of Crude Oil for the week ended June 21, well above the forecast -3 million barrel decline and flooding out the previous week’s -2.547 million barrel drawdown. US Crude Oil markets shuddered after another week-on-week buildup, sending WTI back to the $80.00 handle on reaction.
Energy markets are still holding onto hopes of a summertime uptick in fossil fuel demand on the back of increased cooling costs, as well as the summer driving season. This follows a flubbed uptick in Chinese Crude Oil demand that failed to materialize, as well as the US Memorial Day holiday driving season that also failed to make a meaningful dent in US Crude Oil supplies.
WTI technical outlook
WTI continues to trade in a rough range priced in between $80.00 and $81.50, with a hefty supply zone keeping upside momentum hobbled beyond $81.50. Intraday price action is clattering against the 200-hour Exponential Moving Average (EMA) rising through the $80.00 handle.
Daily candlesticks continue to middle around the $81.00 handle, and continued consolidation opens the way up for a bearish turnaround towards the low side of the 200-day EMA at $78.91. A downside push will leave WTI bids exposed to a further decline to early June’s swing low below $73.00 per barrel.
WTI hourly chart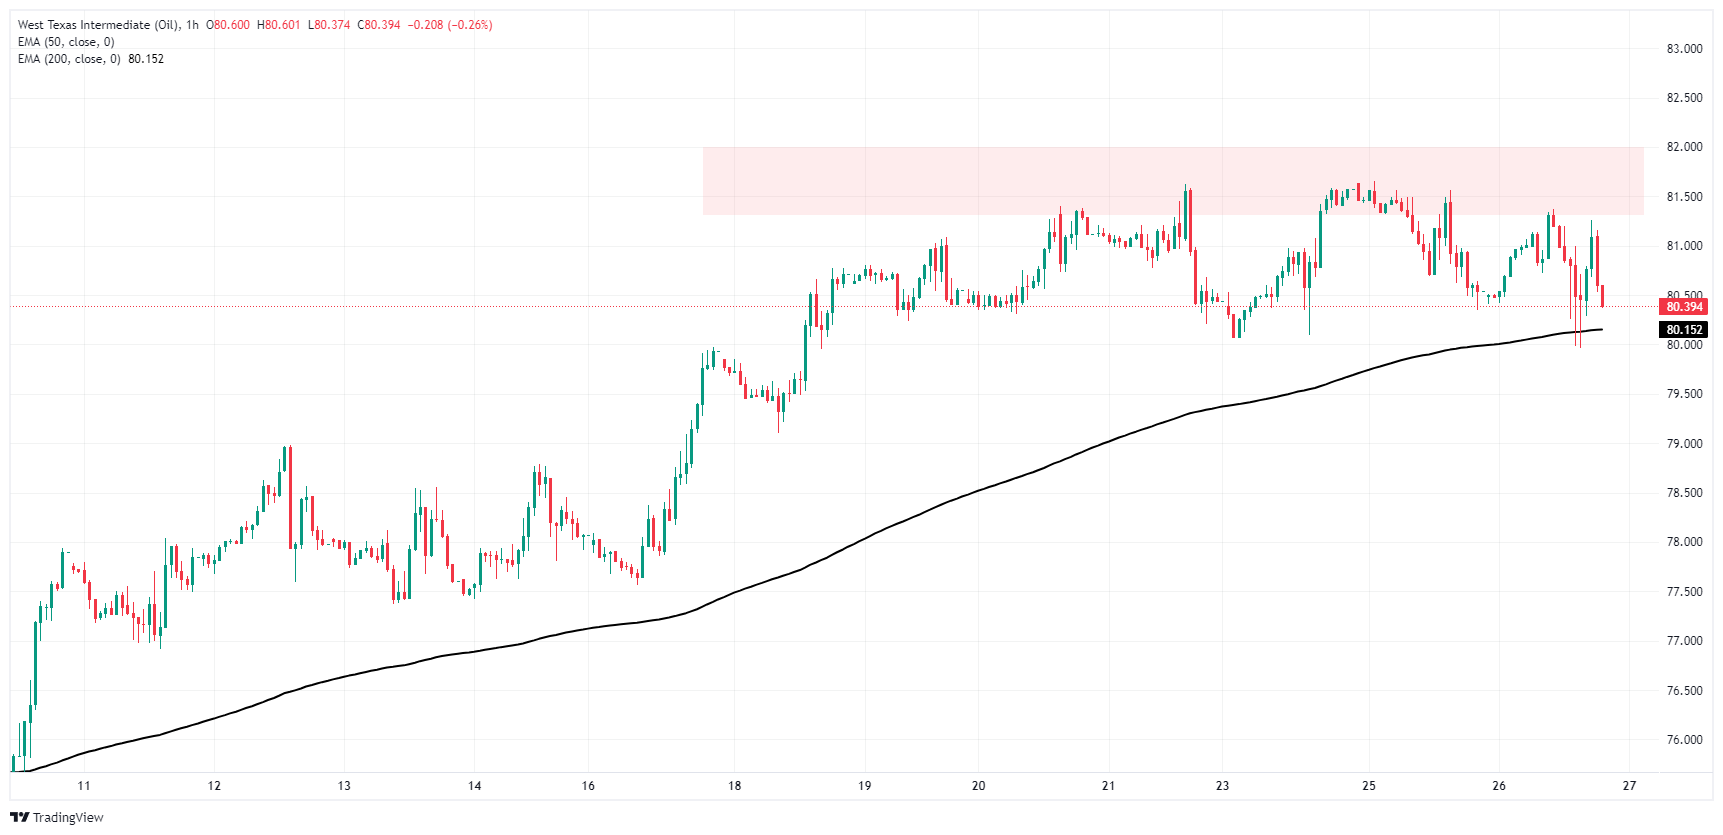
WTI daily chart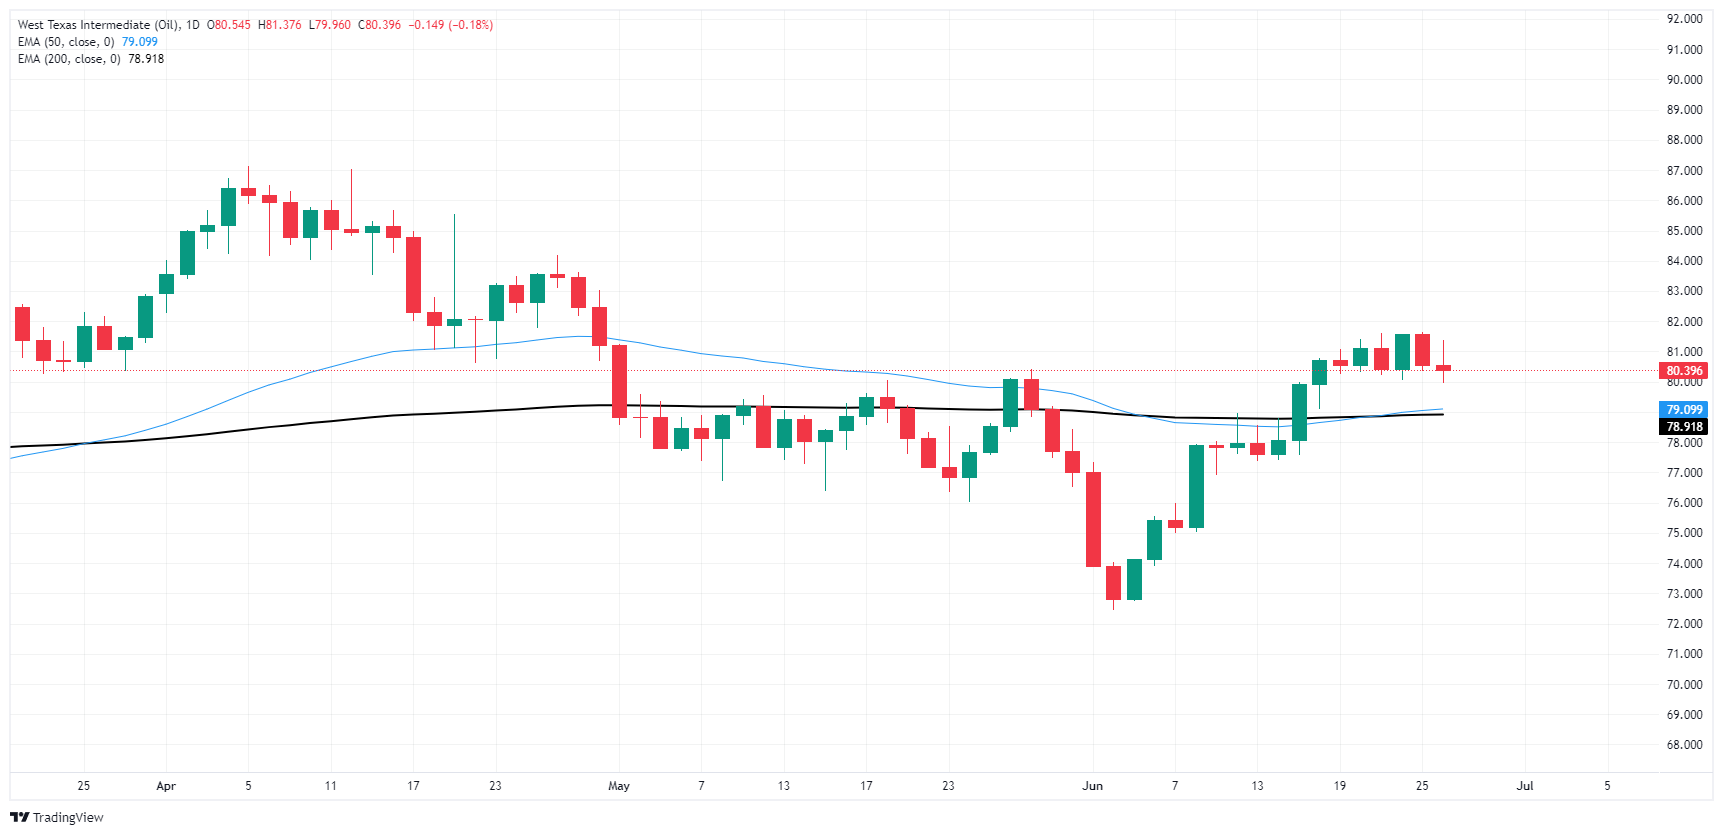
WTI Oil FAQs
WTI Oil is a type of Crude Oil sold on international markets. The WTI stands for West Texas Intermediate, one of three major types including Brent and Dubai Crude. WTI is also referred to as “light” and “sweet” because of its relatively low gravity and sulfur content respectively. It is considered a high quality Oil that is easily refined. It is sourced in the United States and distributed via the Cushing hub, which is considered “The Pipeline Crossroads of the World”. It is a benchmark for the Oil market and WTI price is frequently quoted in the media.
Like all assets, supply and demand are the key drivers of WTI Oil price. As such, global growth can be a driver of increased demand and vice versa for weak global growth. Political instability, wars, and sanctions can disrupt supply and impact prices. The decisions of OPEC, a group of major Oil-producing countries, is another key driver of price. The value of the US Dollar influences the price of WTI Crude Oil, since Oil is predominantly traded in US Dollars, thus a weaker US Dollar can make Oil more affordable and vice versa.
The weekly Oil inventory reports published by the American Petroleum Institute (API) and the Energy Information Agency (EIA) impact the price of WTI Oil. Changes in inventories reflect fluctuating supply and demand. If the data shows a drop in inventories it can indicate increased demand, pushing up Oil price. Higher inventories can reflect increased supply, pushing down prices. API’s report is published every Tuesday and EIA’s the day after. Their results are usually similar, falling within 1% of each other 75% of the time. The EIA data is considered more reliable, since it is a government agency.
OPEC (Organization of the Petroleum Exporting Countries) is a group of 13 Oil-producing nations who collectively decide production quotas for member countries at twice-yearly meetings. Their decisions often impact WTI Oil prices. When OPEC decides to lower quotas, it can tighten supply, pushing up Oil prices. When OPEC increases production, it has the opposite effect. OPEC+ refers to an expanded group that includes ten extra non-OPEC members, the most notable of which is Russia.
Author

Joshua Gibson
FXStreet
Joshua joins the FXStreet team as an Economics and Finance double major from Vancouver Island University with twelve years' experience as an independent trader focusing on technical analysis.


