Crude Oil keeps gains after OPEC delivers most bearish report
- Oil prices holds on to go gains with Biden administration set to issue more sanctions against Russia.
- The monthly OPEC report comes in as the most bearish outlook for 2025
- The US Dollar Index sees gains evaporate after a steady CPI release.

Crude Oil is holding on to roughly 1% gains at the start of the U.S. trading session after OPEC released its most bearish report yet. The global Oil demand outlook for 2025 got revised sharply to the downside. The news that the US is mulling additional Oil embargoes for Russian production did not help either, as it has the potential to weigh on prices.
The US Dollar Index (DXY) – which measures the performance of the US Dollar (USD) against a basket of currencies – is giving back some of its gains after the US Consumer Price Index (CPI) data from November came in as expected. The Federal Reserve (Fed) is now expected to deliver another rate cut in its upcoming meeting.
At the time of writing, Crude Oil (WTI) trades at $69.21 and Brent Crude at $72.87.
Oil news and market movers: Russia faces sanctions
- OPEC+ has released its most bearish outlook for global Oil demand as of yet, Bloomberg reports.
- Saudi Aramco's Oil price cut for January deliveries to Asian buyers -- which account for most of its exports -- reinforces the outlook for soft market fundamentals in the first half of 2025, Reuters reports.
- Falling CFTC speculative net-long positions in Oil futures are the result of traders slashing their risk exposure as they fret over the outlook of the US shale industry during President-elect Donald Trump’s second term and the response from OPEC+, Bloomberg reports.
- The Biden administration is weighing new and tougher sanctions against Russia’s Oil trade in order to tighten the screws on the Kremlin just weeks before President-elect Donald Trump returns to the White House, Bloomberg reports.
- The Energy Information Administration (EIA) is set to release its weekly Crude Stockpile Change report at 15:30 GMT. Expectations are for a drawdown of 1.3 million barrels against the more than 5 million barrels drawdown seen the prior week.
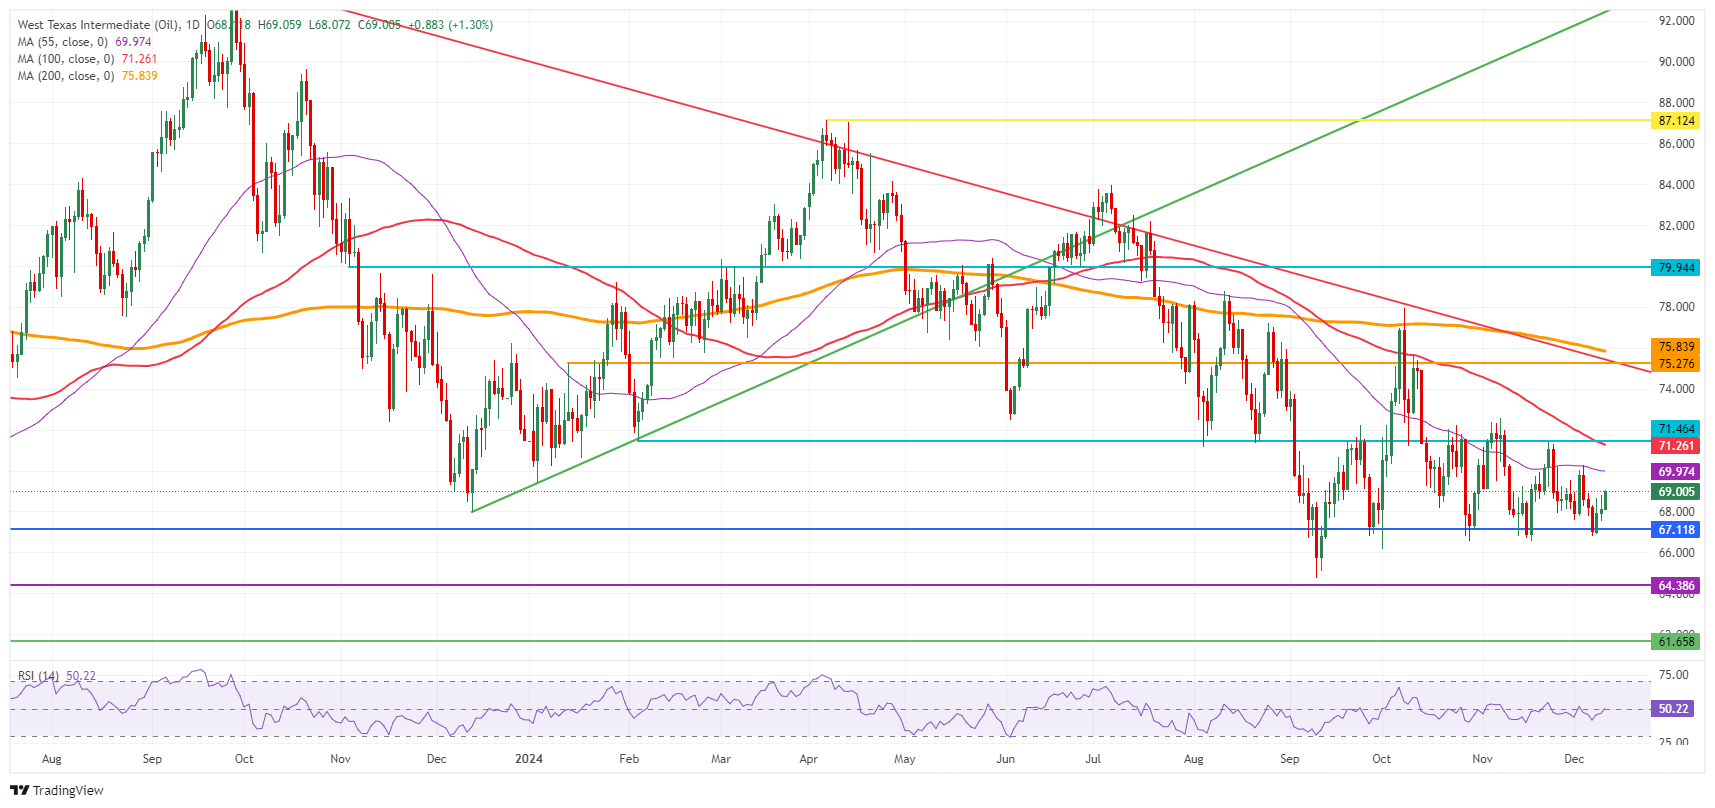
Oil Technical Analysis: Reducing Risk
Crude Oil price is wrong-footed again, facing more downside than upside despite heightened tensions in the Middle East. Traders are instead slashing their positions in Crude Oil and look beyond the near-term bullish drivers, looking forward to the rather bearish silver lining once President-elect Trump takes office. Trump has promised to ramp up Oil production even more, which would weigh on prices.
The 55-day Simple Moving Average (SMA) at $69.96 is the first big resistance level to look out for on the upside. Should tensions in the Middle East flare up further, $71.46 with the 100-day SMA at $71.25 will act as thick resistance. In case Oil traders can plough through that level, $75.27 is up next as a pivotal level.
On the other side, traders see $67.12 – a level that held the price in May and June 2023 – as the last man standing. In case that breaks, the 2024 year-to-date low emerges at $64.75 followed by $64.38, the low from 2023.
US WTI Crude Oil: Daily Chart
WTI Oil FAQs
WTI Oil is a type of Crude Oil sold on international markets. The WTI stands for West Texas Intermediate, one of three major types including Brent and Dubai Crude. WTI is also referred to as “light” and “sweet” because of its relatively low gravity and sulfur content respectively. It is considered a high quality Oil that is easily refined. It is sourced in the United States and distributed via the Cushing hub, which is considered “The Pipeline Crossroads of the World”. It is a benchmark for the Oil market and WTI price is frequently quoted in the media.
Like all assets, supply and demand are the key drivers of WTI Oil price. As such, global growth can be a driver of increased demand and vice versa for weak global growth. Political instability, wars, and sanctions can disrupt supply and impact prices. The decisions of OPEC, a group of major Oil-producing countries, is another key driver of price. The value of the US Dollar influences the price of WTI Crude Oil, since Oil is predominantly traded in US Dollars, thus a weaker US Dollar can make Oil more affordable and vice versa.
The weekly Oil inventory reports published by the American Petroleum Institute (API) and the Energy Information Agency (EIA) impact the price of WTI Oil. Changes in inventories reflect fluctuating supply and demand. If the data shows a drop in inventories it can indicate increased demand, pushing up Oil price. Higher inventories can reflect increased supply, pushing down prices. API’s report is published every Tuesday and EIA’s the day after. Their results are usually similar, falling within 1% of each other 75% of the time. The EIA data is considered more reliable, since it is a government agency.
OPEC (Organization of the Petroleum Exporting Countries) is a group of 12 Oil-producing nations who collectively decide production quotas for member countries at twice-yearly meetings. Their decisions often impact WTI Oil prices. When OPEC decides to lower quotas, it can tighten supply, pushing up Oil prices. When OPEC increases production, it has the opposite effect. OPEC+ refers to an expanded group that includes ten extra non-OPEC members, the most notable of which is Russia.
Author

Filip Lagaart
FXStreet
Filip Lagaart is a former sales/trader with over 15 years of financial markets expertise under its belt.


