Crude Oil dips again after ECB's Lagarde sees more downside risk for Eurozone
- Crude Oil finds support and stabilizes off its weekly low of $69.15 on Thursday.
- Overnight API weekly numbers came in with a surprise drawdown.
- The US Dollar Index breaks above a key level on its way to 104.00.

Crude Oil finds a floor and stabilizes for now on Thursday after a four-day losing streak, which currently still accounts for a nearly 7% loss in the week. The floor that starts to form comes with traders doubting if Israel’s Prime Minister Benjamin Netanyahu will uphold his promise to the United States (US) not to attack Iranian oil installations. An additional support came on the back of the overnight stockpile weekly numbers from the American Petroleum Institute (API), which came in at a surprise drawdown of 1.58 million barrels in the week ending on October 11 compared to an expected build of 2.3 million barrels.
The US Dollar Index (DXY), which tracks the performance of the Greenback against six other currencies, is gearing up for a volatile session ahead. The European Central Bank (ECB) has cut by 25 basis points, but it's President Christine Lagarde said she sees more risks to the downside than to the upside for the Eurozone. Meanwhile the US Retail Sales came in strong at 0.4% against 0.3% expected, which means the US consumer is still happy to spend and buy, pointing to healthy domestic demand.
At the time of writing, Crude Oil (WTI) trades at $70.00 and Brent Crude at $74.02
Oil news and market movers: EIA up next
- China has announced a support plan for its domestic housing market. The size of the investment will be 4 trillion Yuan (CNY), while earlier this week on Monday, a message of about 6 trillion Yuan was communicated. Asian markets did not react well to the lower number, according to Bloomberg.
- Pressure keeps building on Israel’s Prime Minister Benjamin Netanyahu to ignore the US‘s request not to target Iranian oil installations. Unease is growing now even within his cabinet after an article in the Jerusalem Post on Tuesday from the opposition leader calling for an immediate attack on the Iranian installations, Reuters reports.
- At 15:00 GMT, the Energy Information Administration (EIA) will release its weekly stockpile change numbers for the week ending on October 11. Expectations are for a small build of 2.3 million compared to the previous build of 5.81 million the prior week.
Oil Technical Analysis: Steady despite all moving parts
Crude Oil battles to hold the $70.00 marker, but it will not be an easy task from here. Although lingering geopolitical tensions could push Crude Oil prices rapidly up, the whole thing could quickly crumble down if no events occur. While several other asset classes are moving with markets hedging for a potential presidential win for former US President Donald Trump in the November 5 presidential elections in the US, it becomes clear Crude Oil has no clue how to price in a Trump win.
There is a challenging path to recovery for Crude Oil in the coming days. First, the pivotal level at $71.46, which was strong enough to catch the falling knife on Monday, must be regained again with a daily close above it. Once from there, the hefty technical level at $75.28, with the 100-day Simple Moving Average (SMA) and a few pivotal lines, is possibly the first big hurdle ahead.
On the downside, that previously mentioned $71.46 pivotal level has now turned into resistance and no longer has any value as support. Instead, traders need to look much lower, at $67.11, a level that supported the price in May-June 2023. In case that level breaks, the 2024 year-to-date low emerges at $64.75 followed by $64.38, the low of 2023.
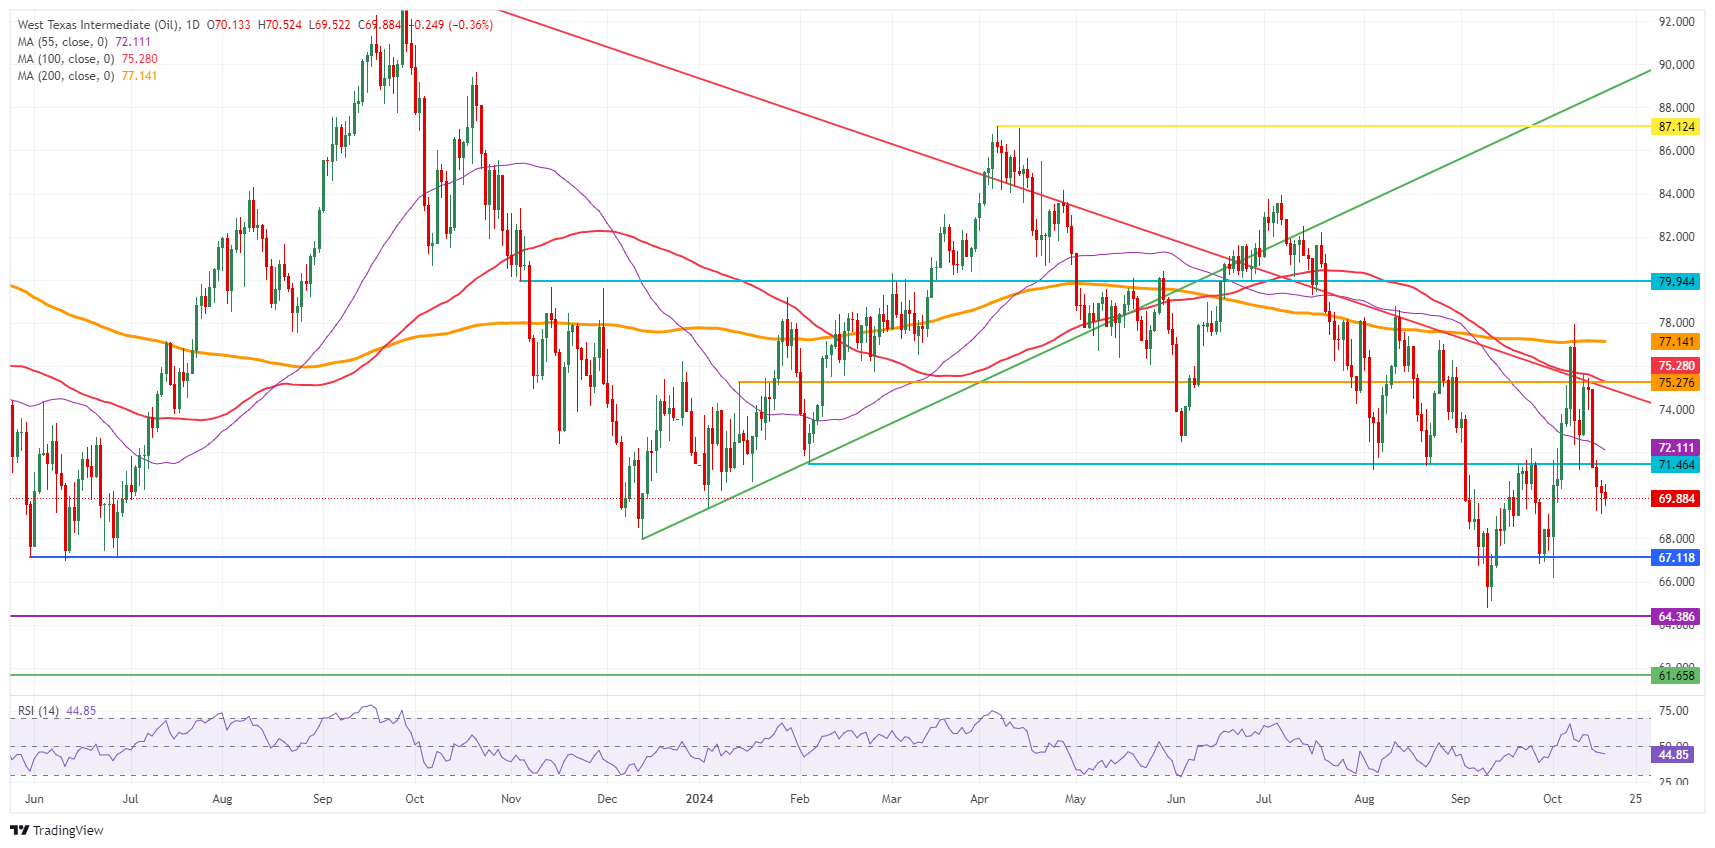
US WTI Crude Oil: Daily Chart
WTI Oil FAQs
WTI Oil is a type of Crude Oil sold on international markets. The WTI stands for West Texas Intermediate, one of three major types including Brent and Dubai Crude. WTI is also referred to as “light” and “sweet” because of its relatively low gravity and sulfur content respectively. It is considered a high quality Oil that is easily refined. It is sourced in the United States and distributed via the Cushing hub, which is considered “The Pipeline Crossroads of the World”. It is a benchmark for the Oil market and WTI price is frequently quoted in the media.
Like all assets, supply and demand are the key drivers of WTI Oil price. As such, global growth can be a driver of increased demand and vice versa for weak global growth. Political instability, wars, and sanctions can disrupt supply and impact prices. The decisions of OPEC, a group of major Oil-producing countries, is another key driver of price. The value of the US Dollar influences the price of WTI Crude Oil, since Oil is predominantly traded in US Dollars, thus a weaker US Dollar can make Oil more affordable and vice versa.
The weekly Oil inventory reports published by the American Petroleum Institute (API) and the Energy Information Agency (EIA) impact the price of WTI Oil. Changes in inventories reflect fluctuating supply and demand. If the data shows a drop in inventories it can indicate increased demand, pushing up Oil price. Higher inventories can reflect increased supply, pushing down prices. API’s report is published every Tuesday and EIA’s the day after. Their results are usually similar, falling within 1% of each other 75% of the time. The EIA data is considered more reliable, since it is a government agency.
OPEC (Organization of the Petroleum Exporting Countries) is a group of 12 Oil-producing nations who collectively decide production quotas for member countries at twice-yearly meetings. Their decisions often impact WTI Oil prices. When OPEC decides to lower quotas, it can tighten supply, pushing up Oil prices. When OPEC increases production, it has the opposite effect. OPEC+ refers to an expanded group that includes ten extra non-OPEC members, the most notable of which is Russia.
Author

Filip Lagaart
FXStreet
Filip Lagaart is a former sales/trader with over 15 years of financial markets expertise under its belt.


