Crude Oil nosedives over 5% as commodity traders flee the scene
- Crude Oil falls over 5% on Tuesday with concerns over China hitting markets
- Israel remains muted in its reaction to Iran's recent attacks.
- The US Dollar Index turns flat this Tuesday and looks to halt the recent fade that was taking place.

Crude Oil is seeing losses accelerate after the US Opening Bell and is starting to sell off. Major concerns on China after no additional stimulus announcements came at the reopening of China's stock markets opening after a one-week closure due to Golden Week. The commodity complex is facing substantial selling pressure with markets demanding more impact from China to relaunch its economy and econonomic activity both domestic and abroad.
The US Dollar Index (DXY), which tracks the performance of the Greenback against six other currencies, is turning flat with the US Opening Bell ending the small fade that was taking place. The DXY saw a steep short squeeze last week, with US Dollar bears being washed out of their position in the process. Slowly but surely, the US Dollar (USD) bulls are starting to take profit in the rally, with the DXY in a slow grind lower in search of first support.
At the time of writing, Crude Oil (WTI) trades at $72.97 and Brent Crude at $77.02
Oil news and market movers: China hits commodity complex
- Russian Crude Exports climb further and hit the highest level since July, Bloomberg data shows.
- Libya’s Oil production has climbed above 1 million barrels per day for the first time in two months after the resolution of a political standoff in the country, Bloomberg reports.
- Chevron shut in Oil production at the Blind Faith platform in the US Gulf of Mexico ahead of Hurricane Milton, Reuters reports.
- Chevron Corp and Canadian Natural Resources Ltd. signed a $6.5 billion deal for Chevron to sell the undeveloped oil sands in the Alberta province in Canada, Rigzone reports.
- Hurricane Milton is making its way through the Gulf Coast toward the US peninsula of Florida and is set to hit by Wednesday morning, according to recent data from the US National Hurricane Center.
- At 20:30 GMT, the American Petroleum Institute (API) will release its weekly Crude Oil stockpile change numbers. Last week there was a draw of 1.5 million barrels, with a build of 1.95 million expected for this week.
Oil Technical Analysis: Frontrunning fails big time
Crude Oil price was bound to see some selling after its steep rally higher due to the mixture of geopolitical tensions. With time passing and Israel not really delivering a military response, tensions are starting to ease a touch. Add in Libya news and China concerns, and the correction gets more weight. Expect to see possibly a further correction until strong support is found.
Monday’s false break is to be ignored as the move has been fully paired back on Tuesday. It thus means that current pivotal levels on the upside are still valid: the red descending trendline in the chart below, and the 100-day Simple Moving Average (SMA) at $75.72 just hovering above it, makes that region very difficult to surpass. Once holding above there, the 200-day SMA at $77.15 should refute any further upticks as it did in early trading on Tuesday.
On the downside, old resistances have turned into supports. First is the 55-day SMA at $72.71, which acts as a potential first line of defense in case of any retreat. A bit further down, $71.46 comes into play as second support before looking back to the $70.00 big figure and $67.11 as ultimate support for traders to buy the dip.
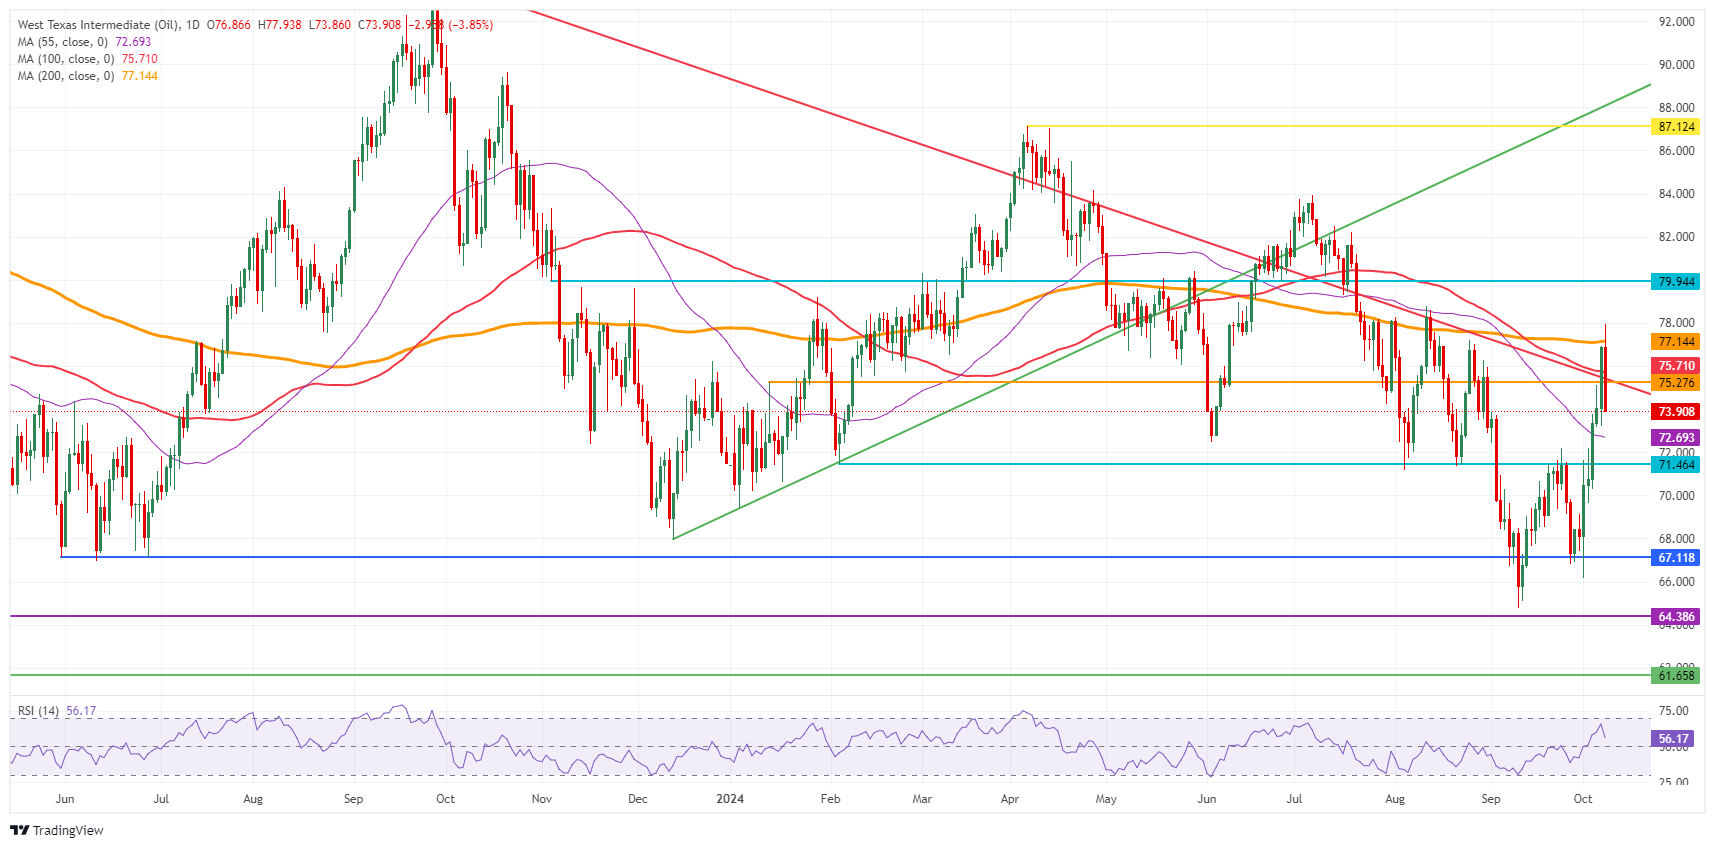
US WTI Crude Oil: Daily Chart
WTI Oil FAQs
WTI Oil is a type of Crude Oil sold on international markets. The WTI stands for West Texas Intermediate, one of three major types including Brent and Dubai Crude. WTI is also referred to as “light” and “sweet” because of its relatively low gravity and sulfur content respectively. It is considered a high quality Oil that is easily refined. It is sourced in the United States and distributed via the Cushing hub, which is considered “The Pipeline Crossroads of the World”. It is a benchmark for the Oil market and WTI price is frequently quoted in the media.
Like all assets, supply and demand are the key drivers of WTI Oil price. As such, global growth can be a driver of increased demand and vice versa for weak global growth. Political instability, wars, and sanctions can disrupt supply and impact prices. The decisions of OPEC, a group of major Oil-producing countries, is another key driver of price. The value of the US Dollar influences the price of WTI Crude Oil, since Oil is predominantly traded in US Dollars, thus a weaker US Dollar can make Oil more affordable and vice versa.
The weekly Oil inventory reports published by the American Petroleum Institute (API) and the Energy Information Agency (EIA) impact the price of WTI Oil. Changes in inventories reflect fluctuating supply and demand. If the data shows a drop in inventories it can indicate increased demand, pushing up Oil price. Higher inventories can reflect increased supply, pushing down prices. API’s report is published every Tuesday and EIA’s the day after. Their results are usually similar, falling within 1% of each other 75% of the time. The EIA data is considered more reliable, since it is a government agency.
OPEC (Organization of the Petroleum Exporting Countries) is a group of 12 Oil-producing nations who collectively decide production quotas for member countries at twice-yearly meetings. Their decisions often impact WTI Oil prices. When OPEC decides to lower quotas, it can tighten supply, pushing up Oil prices. When OPEC increases production, it has the opposite effect. OPEC+ refers to an expanded group that includes ten extra non-OPEC members, the most notable of which is Russia.
Author

Filip Lagaart
FXStreet
Filip Lagaart is a former sales/trader with over 15 years of financial markets expertise under its belt.


