Crude Oil eases on Tuesday despite extended decline in API barrel counts
- WTI backslid to $81.00 as energy market concerns weigh heavy.
- API reported a second, albeit smaller drawdown in US Crude Oil supplies.
- Chinese demand remains lower than expected in 2024, risk bid from Beryl evaporates.

West Texas Intermediate (WTI) US Crude Oil extended a near term decline on Tuesday, falling to $81.00 per barrel as American Crude Oil markets continue to struggle to find consistent bullish momentum.
The American Petroleum Institute (API) reported another week-on-week decline in US Weekly Crude Oil Stock for the week ended July 5. According to the API, US weekly barrel counts fell by another 1.9 million, adding to the previous week’s sharp decline of 9.163 million and undershooting the forecast -250K barrel drawdown. Crude Oil prices remain tepid to soft on Tuesday as US Distillate Stocks, Crude Oil derivatives primarily used for diesel and home heating and cooling production bounced 2.3 million and entirely missing the forecast decline of -740K drawdown.
Chinese demand continues to undershoot broad market expectations for overall upticks in Asian fossil fuel usage. Crude Oil bullish momentum that hinged on an uptick of demand earlier in the year has thus far not born fruit.
Tropical Storm Beryl, which was downgraded from a category 1 hurricane, also failed to disrupt US Crude Oil markets as much as barrel traders had initially feared, kicking the legs out from underneath a near-term bullish push and keeping WTI bids pinned on the low side.
Economic Indicator
API Weekly Crude Oil Stock
API’s Weekly Statistical Bulletin (WSB) has reported total U.S. and regional data relating to refinery operations and the production of the four major petroleum products: motor gasoline, kerosene jet fuel, distillate (by sulfur content), and residual fuel oil. These products represent more than 85% of total petroleum industry.
Read more.Last release: Tue Jul 09, 2024 20:30
Frequency: Weekly
Actual: -1.9M
Consensus: -0.25M
Previous: -9.163M
Source: American Petroleum Institute
WTI technical outlook
WTI remains mired in near-term technical consolidation, backsliding below previous technical support from $81.50 and slipping beneath the 200-hour Exponential Moving Average (EMA) at $81.96.
Daily candles broke north of a consolidation pattern cooked into the charts from mid-June, but price action has fallen back into technical congestion as bears look set to drag bids down to the 200-day EMA at $79.19.
WTI hourly chart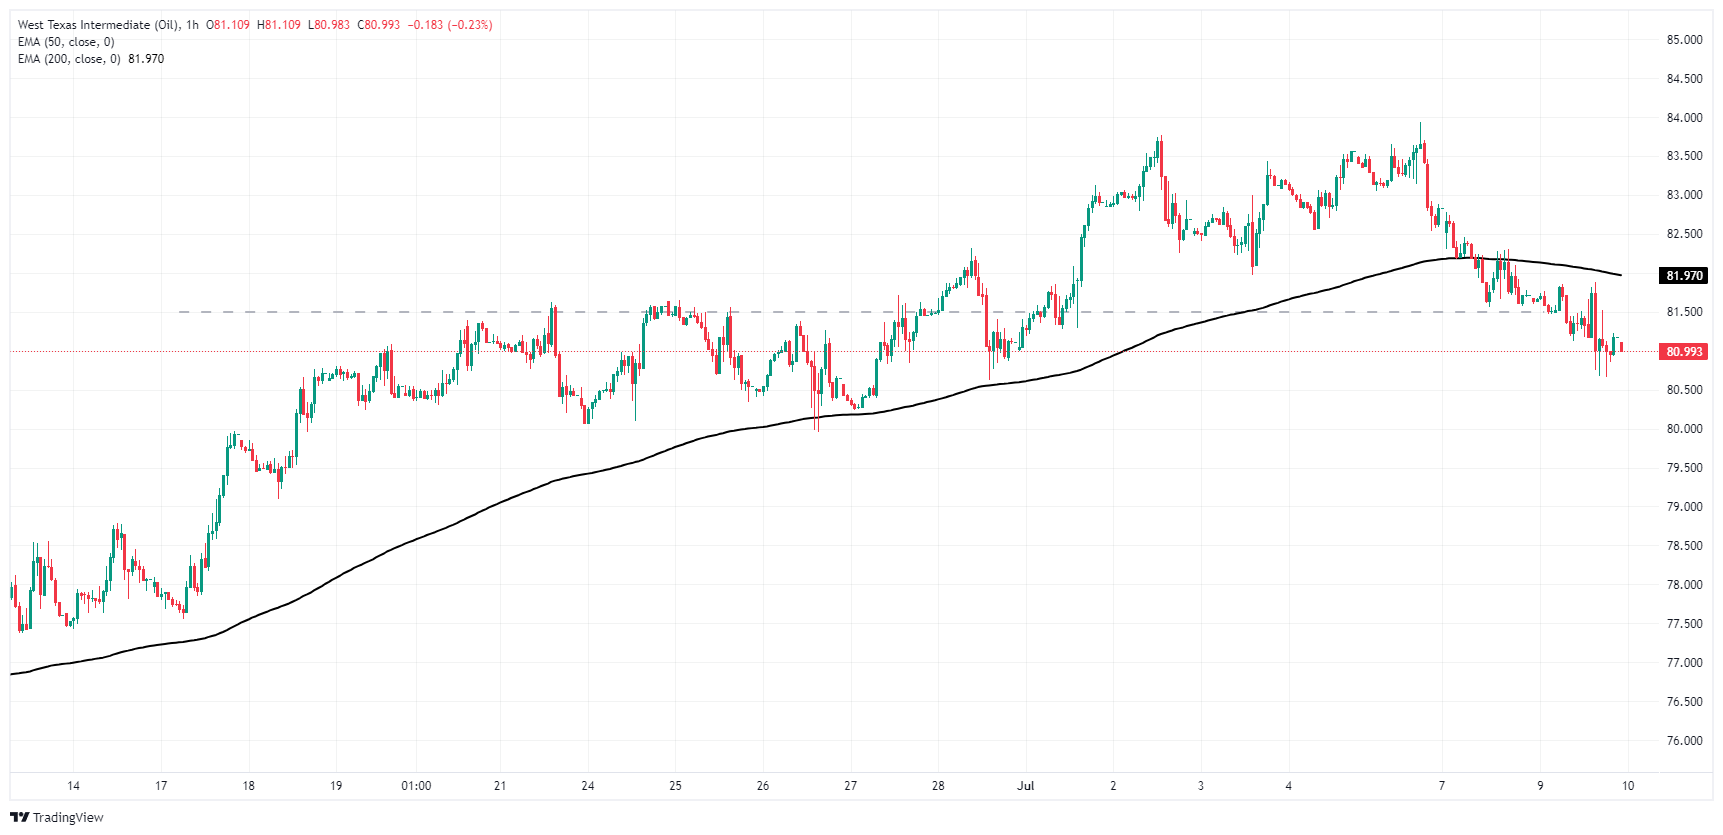
WTI daily chart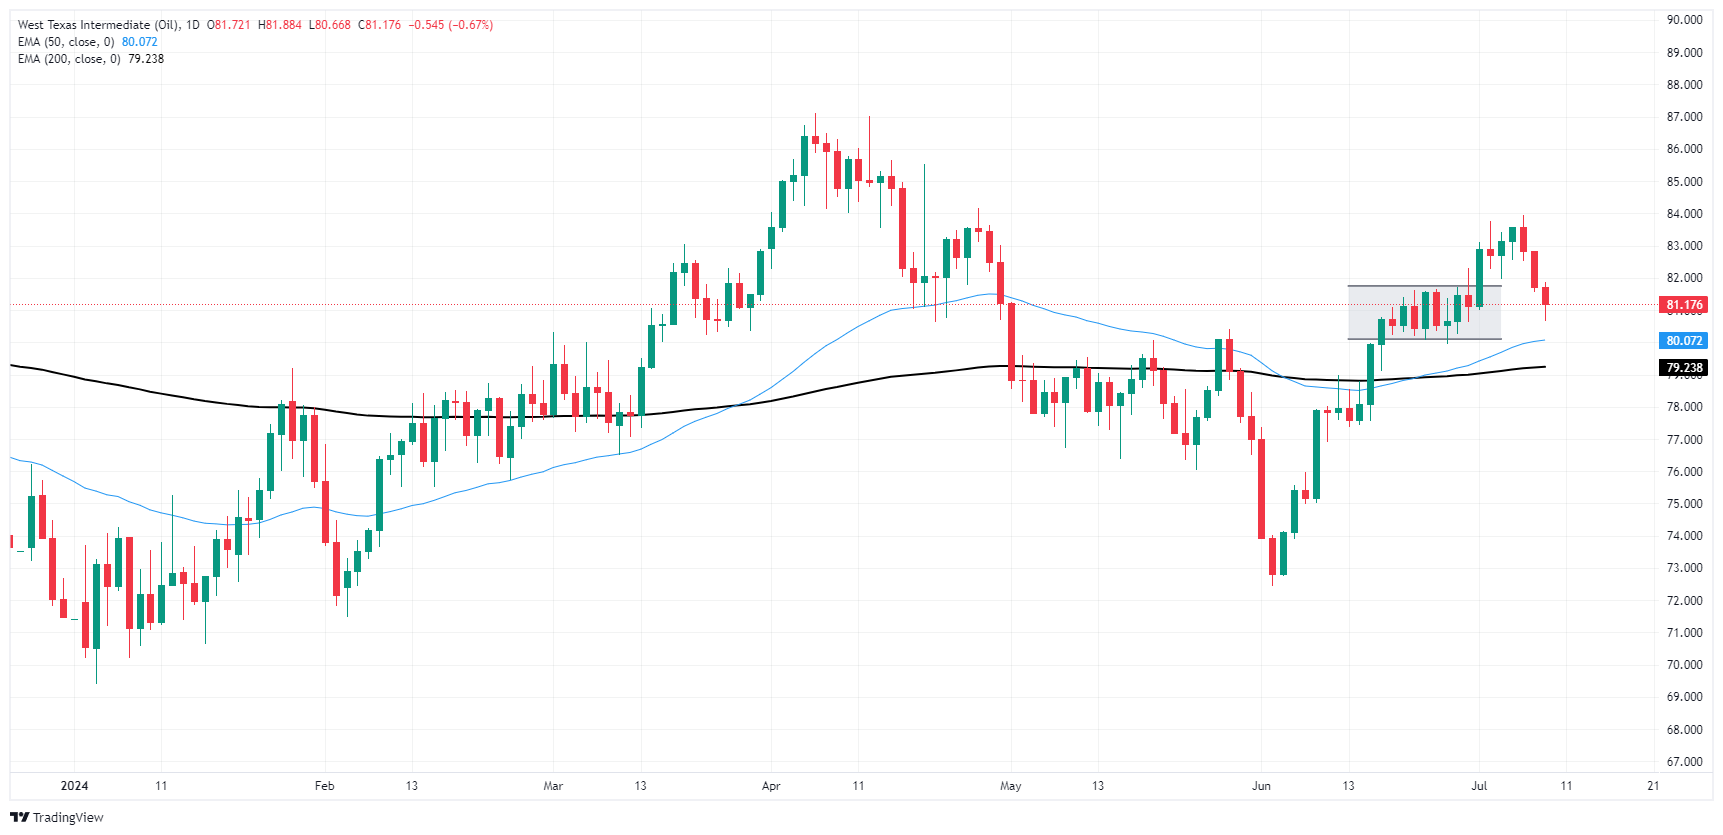
WTI Oil FAQs
WTI Oil is a type of Crude Oil sold on international markets. The WTI stands for West Texas Intermediate, one of three major types including Brent and Dubai Crude. WTI is also referred to as “light” and “sweet” because of its relatively low gravity and sulfur content respectively. It is considered a high quality Oil that is easily refined. It is sourced in the United States and distributed via the Cushing hub, which is considered “The Pipeline Crossroads of the World”. It is a benchmark for the Oil market and WTI price is frequently quoted in the media.
Like all assets, supply and demand are the key drivers of WTI Oil price. As such, global growth can be a driver of increased demand and vice versa for weak global growth. Political instability, wars, and sanctions can disrupt supply and impact prices. The decisions of OPEC, a group of major Oil-producing countries, is another key driver of price. The value of the US Dollar influences the price of WTI Crude Oil, since Oil is predominantly traded in US Dollars, thus a weaker US Dollar can make Oil more affordable and vice versa.
The weekly Oil inventory reports published by the American Petroleum Institute (API) and the Energy Information Agency (EIA) impact the price of WTI Oil. Changes in inventories reflect fluctuating supply and demand. If the data shows a drop in inventories it can indicate increased demand, pushing up Oil price. Higher inventories can reflect increased supply, pushing down prices. API’s report is published every Tuesday and EIA’s the day after. Their results are usually similar, falling within 1% of each other 75% of the time. The EIA data is considered more reliable, since it is a government agency.
OPEC (Organization of the Petroleum Exporting Countries) is a group of 13 Oil-producing nations who collectively decide production quotas for member countries at twice-yearly meetings. Their decisions often impact WTI Oil prices. When OPEC decides to lower quotas, it can tighten supply, pushing up Oil prices. When OPEC increases production, it has the opposite effect. OPEC+ refers to an expanded group that includes ten extra non-OPEC members, the most notable of which is Russia.
Author

Joshua Gibson
FXStreet
Joshua joins the FXStreet team as an Economics and Finance double major from Vancouver Island University with twelve years' experience as an independent trader focusing on technical analysis.