Crude Oil heads into second downbeat trading day ahead of API
- Oil prices are seeing losses thinken in the US trading session after an already downbeat trading day.
- Pemex is the main driver this Tuesday for the downturn, reporting that its Gulf platforms are back up running full capacity.
- The US Dollar Index trades around 107.00 and is broadly gaining against most major peers.

Crude Oil is extending losses by more than 1% at the start of the US trading session after news that Pemex – the Mexican state-owned Oil producer – has fully resumed operations in all its platforms in the Gulf region. The news comes with the end of the annual hurricane season and improving weather conditions, which means more supply is set to come online. That supply will be enough to match the decline in Russian Seaborne Crude which shrunk by 11% since October due to maintenance at one of the country's main export terminals.
The US Dollar Index (DXY) – which measures the performance of the US Dollar (USD) against a basket of currencies – is up against nearly every major currency this Tuesday. The move is still being fueled by the preliminary US Purchasing Managers Index (PMI) release for December, which showed that the economy expanded at the steepest pace in 33 months driven by the services sector. Meanwhile, traders brace for the Retail Sales release on Tuesday and the Federal Reserve rate decision on Wednesday.
At the time of writing, Crude Oil (WTI) trades at $69.30 and Brent Crude at $72.66
Oil news and market movers: API could sink it
- Pemex’s Oil platforms and all crude-exporting terminals are operating normally after weather conditions improved in the Gulf of Mexico, according to a statement from the group, Bloomberg reports.
- The EU has imposed sanctions on Dutch national Niels Troost. Troost allegedly was involved in trading Russian Oil above the price cap set by Western countries in response to Moscow’s full-scale invasion of Ukraine, the FT reports.
- Around 21:30 GMT, the American Petroleum Institute (API) will release its weekly Crude Stock Pile numbers for the week of December 13. Last week, there was a build of 0.499 million barrels.
- Russian seaborne crude shipments are falling. Bloomberg reports shipments fell by about 11% since October, with maintenance work at one of the country’s main export terminals pushing flows even lower in recent weeks.
Oil Technical Analysis: Heading to $69.00
Crude Oil prices are softening on Tuesday, with possibly the peak of last week at $70.96 as the high for now. There isa rather steady bandwidth visible on the charts, with $67.00 as lower band and $71.50 as upper band, and this range looks set to extend into January 2025.
Looking up, $71.46 and the 100-day Simple Moving Average (SMA) at $71.03 are acting as firm resistance levels. On Friday, already some selling pressure emerged ahead of that same 100-day SMA. In case Oil traders can plough through that level, $75.27 is up next as a pivotal level, though watch out for quick profit taking with the year-end quickly nearing.
On the downside, it is too early to see if the 55-day SMA will be reclaimed again at $70.12. That means that $67.12 – a level that held the price in May and June 2023 – is still the first solid support nearby. In case that breaks, the 2024 year-to-date low emerges at $64.75 followed by $64.38, the low from 2023.
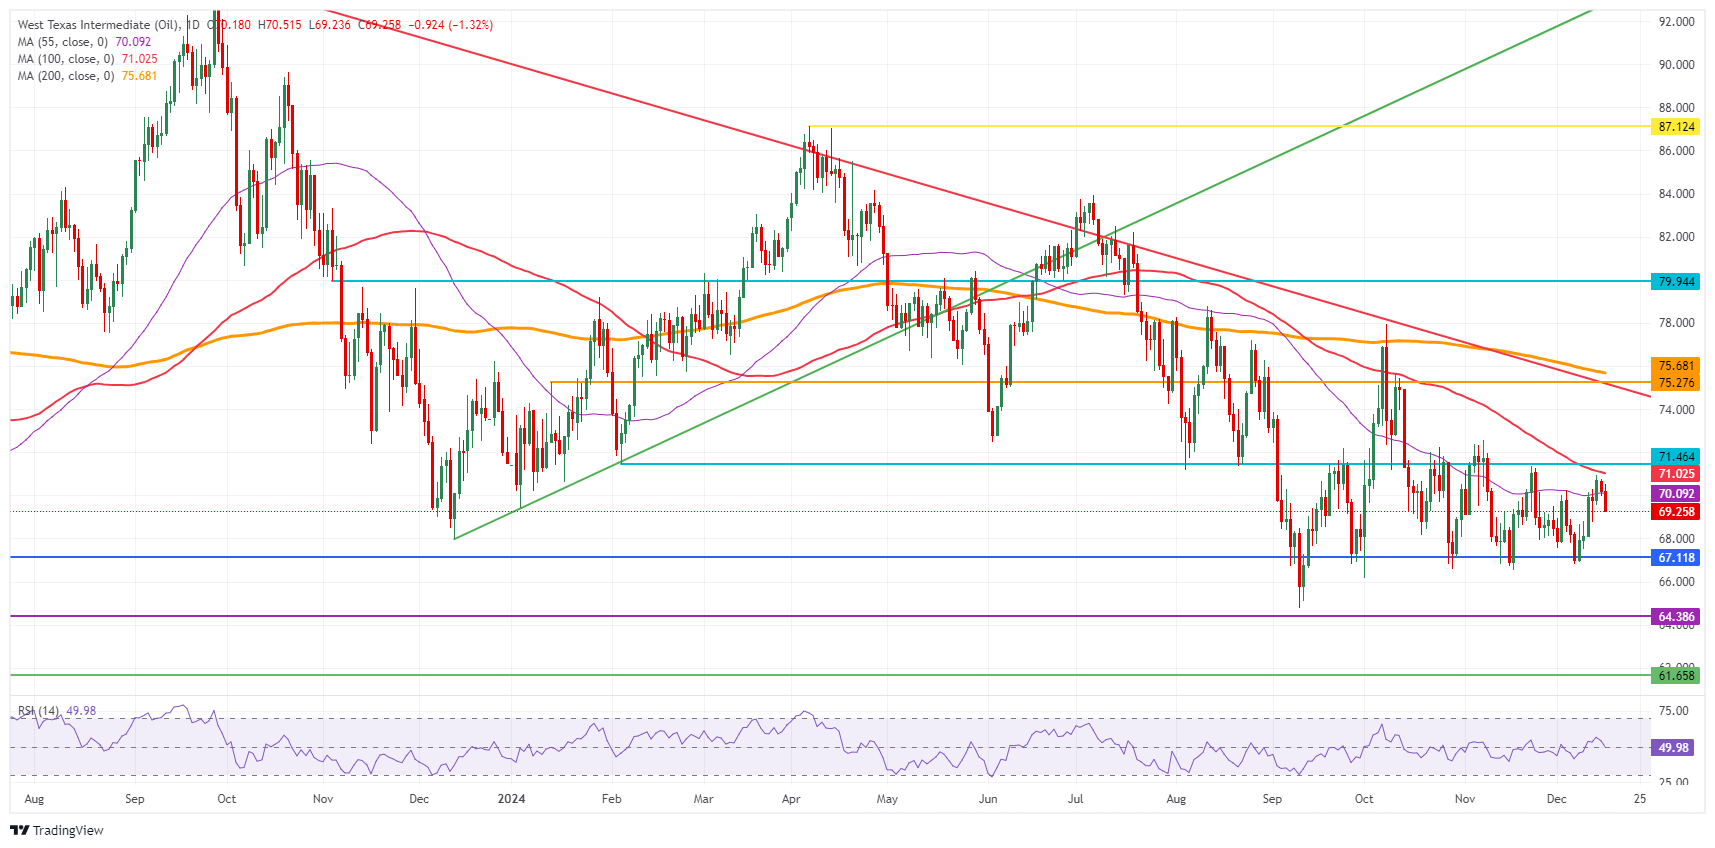
US WTI Crude Oil: Daily Chart
WTI Oil FAQs
WTI Oil is a type of Crude Oil sold on international markets. The WTI stands for West Texas Intermediate, one of three major types including Brent and Dubai Crude. WTI is also referred to as “light” and “sweet” because of its relatively low gravity and sulfur content respectively. It is considered a high quality Oil that is easily refined. It is sourced in the United States and distributed via the Cushing hub, which is considered “The Pipeline Crossroads of the World”. It is a benchmark for the Oil market and WTI price is frequently quoted in the media.
Like all assets, supply and demand are the key drivers of WTI Oil price. As such, global growth can be a driver of increased demand and vice versa for weak global growth. Political instability, wars, and sanctions can disrupt supply and impact prices. The decisions of OPEC, a group of major Oil-producing countries, is another key driver of price. The value of the US Dollar influences the price of WTI Crude Oil, since Oil is predominantly traded in US Dollars, thus a weaker US Dollar can make Oil more affordable and vice versa.
The weekly Oil inventory reports published by the American Petroleum Institute (API) and the Energy Information Agency (EIA) impact the price of WTI Oil. Changes in inventories reflect fluctuating supply and demand. If the data shows a drop in inventories it can indicate increased demand, pushing up Oil price. Higher inventories can reflect increased supply, pushing down prices. API’s report is published every Tuesday and EIA’s the day after. Their results are usually similar, falling within 1% of each other 75% of the time. The EIA data is considered more reliable, since it is a government agency.
OPEC (Organization of the Petroleum Exporting Countries) is a group of 12 Oil-producing nations who collectively decide production quotas for member countries at twice-yearly meetings. Their decisions often impact WTI Oil prices. When OPEC decides to lower quotas, it can tighten supply, pushing up Oil prices. When OPEC increases production, it has the opposite effect. OPEC+ refers to an expanded group that includes ten extra non-OPEC members, the most notable of which is Russia.
Author

Filip Lagaart
FXStreet
Filip Lagaart is a former sales/trader with over 15 years of financial markets expertise under its belt.


