Canadian Dollar backslides into another low with Canadian CPI inflation around the corner
- The Canadian Dollar shed another quarter percent against the Greenback.
- Canada kicked off a new trading week with an extended holiday.
- Canadian CPI inflation figures due on Tuesday, BoC rate call looms over the horizon.

The Canadian Dollar (CAD) kicked off the new trading week with another loss against the US Dollar, falling another quarter of a percent against the Greenback. The Loonie has declined against the USD for a ninth consecutive trading day, and has shed nearly 3% from September’s seven-month peak.
Canadian Consumer Price Index (CPI) inflation figures are due on Tuesday, just in time for Canadian exchanges to return to the fold after taking an extended weekend for Canada’s Thanksgiving holiday.
Daily digest market movers
- The Canadian Dollar lost another quarter percent as Loonie traders continue to abandon the CAD and global FX markets bid the Greenback even higher.
- Canadian markets are dark on Monday for the Thanksgiving extended holiday weekend.
- Canadian CPI inflation for September is due Tuesday.
- The Bank of Canada’s (BoC) own core CPI print last came in at 1.5% YoY.
- The Canadian Wholesale Price Index for September is expected to tick down to 1.8% YoY from the previous 2.0%.
- Canadian CPI inflation figures are unlikely to drive much positive sentiment for the CAD with the BoC broadly expected to slash interest rates another 50 bps on October 23.
Canadian Dollar price forecast
USD/CAD shows a clear bullish trend on the daily candlesticks, with the pair breaking above its 50-day Exponential Moving Average (EMA) near 1.3600, and is now trading into 1.3800.. The pair has risen steadily after a brief consolidation phase in mid-September, indicating strong upward momentum. The 50-day EMA is set to cross above the 200-day EMA, forming a bullish crossover known as a “golden cross,” which typically signals a long-term uptrend.
In terms of momentum indicators, the Moving Average Convergence-Divergence (MACD) is showing a strong bullish crossover as well. The MACD fast line (blue) has moved above the signal line (orange), and the histogram is rising, confirming strengthening bullish momentum and implying that the current rally could extend in the near term.
Looking ahead, the next key resistance level is around 1.38500, just slightly above current prices, where sellers may step in. On the downside, support is found near the 50-day and 200-day EMAs which are consolidating near 1.3600, which should act as a strong buffer against any corrective moves. As long as the pair holds above these levels, the outlook remains bullish with the potential for continued upside gains.
USD/CAD daily chart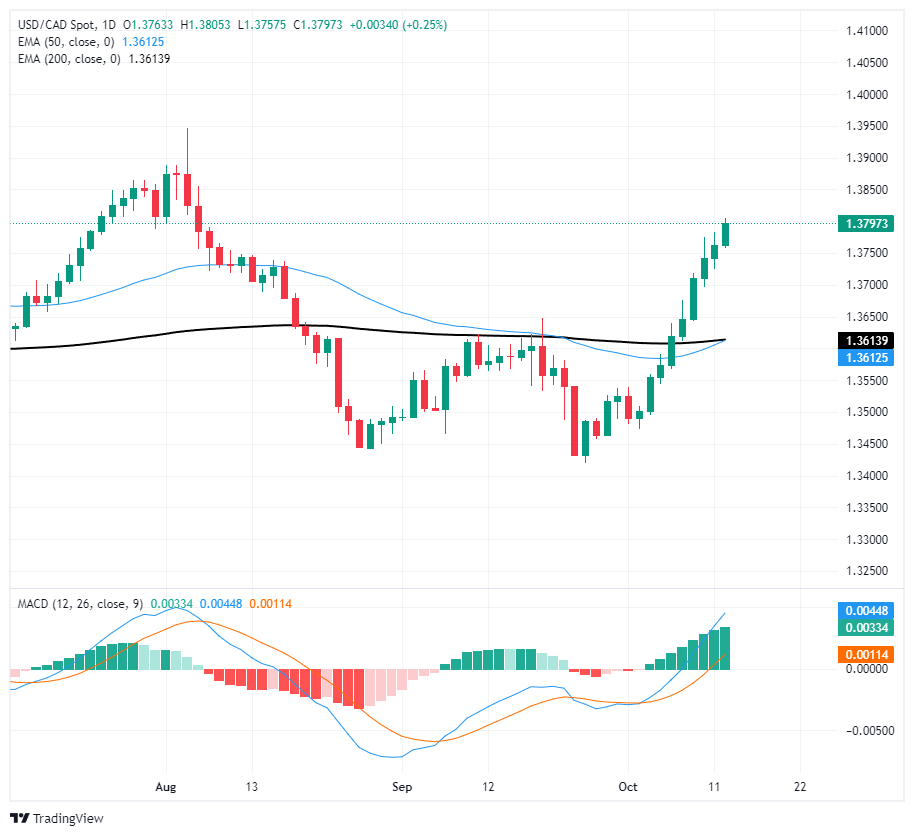
Inflation FAQs
Inflation measures the rise in the price of a representative basket of goods and services. Headline inflation is usually expressed as a percentage change on a month-on-month (MoM) and year-on-year (YoY) basis. Core inflation excludes more volatile elements such as food and fuel which can fluctuate because of geopolitical and seasonal factors. Core inflation is the figure economists focus on and is the level targeted by central banks, which are mandated to keep inflation at a manageable level, usually around 2%.
The Consumer Price Index (CPI) measures the change in prices of a basket of goods and services over a period of time. It is usually expressed as a percentage change on a month-on-month (MoM) and year-on-year (YoY) basis. Core CPI is the figure targeted by central banks as it excludes volatile food and fuel inputs. When Core CPI rises above 2% it usually results in higher interest rates and vice versa when it falls below 2%. Since higher interest rates are positive for a currency, higher inflation usually results in a stronger currency. The opposite is true when inflation falls.
Although it may seem counter-intuitive, high inflation in a country pushes up the value of its currency and vice versa for lower inflation. This is because the central bank will normally raise interest rates to combat the higher inflation, which attract more global capital inflows from investors looking for a lucrative place to park their money.
Formerly, Gold was the asset investors turned to in times of high inflation because it preserved its value, and whilst investors will often still buy Gold for its safe-haven properties in times of extreme market turmoil, this is not the case most of the time. This is because when inflation is high, central banks will put up interest rates to combat it. Higher interest rates are negative for Gold because they increase the opportunity-cost of holding Gold vis-a-vis an interest-bearing asset or placing the money in a cash deposit account. On the flipside, lower inflation tends to be positive for Gold as it brings interest rates down, making the bright metal a more viable investment alternative.
Author

Joshua Gibson
FXStreet
Joshua joins the FXStreet team as an Economics and Finance double major from Vancouver Island University with twelve years' experience as an independent trader focusing on technical analysis.















