Canadian Dollar sheds weight to kick off new trading week
- he Canadian Dollar continues to lose ground to the Greenback.
- Markets have tilted into a broadly risk-off stance to kick off the new week.
- Canada remains largely absent from the economic calendar until Friday.

The Canadian Dollar (CAD) backslid into long-term averages against the US Dollar on Monday, with markets opening up the new trading week notably on the back foot. Investors pulled back into the safety of the Greenback, sending the Canadian Dollar skidding into three-week lows.
Meaningful economic data from Canada remains entirely absent from the economic data docket this week, at least until fresh prints in Canadian labor data, due on Friday. Canadian Trade Balance figures are due on Tuesday but are almost guaranteed to have little to no market impact.
Daily digest market movers
- Rising risk-off sentiment pummels the CAD on Monday.
- Markets are facing a lower forecast for the pace of rate cuts than many expected earlier in the year.
- Odds of further outsized rate cuts from the Fed are evaporating as the US labor market remains stubbornly healthy.
- Fed remains tepid on further rate cuts, bets of no rate change in November are on the rise.
- Fed's Kashkari: Balance of risks has tilted toward higher unemployment
Canadian Dollar price forecast
USD/CAD is currently trading at 1.36245, having recently bounced from the 1.3500 level. Notably, price action has moved above the 200-day Exponential Moving Average (EMA), a critical level that often signals a shift in trend direction when breached. The break above this longer-term EMA suggests that bullish momentum may be gaining traction, and this level could act as a new support zone.
Additionally, the 50-day EMA is slightly below the current price, further reinforcing the bullish outlook. The crossing above both the 50-day and 200-day EMAs in quick succession strengthens the case for a potential rally in the coming days, assuming no significant pullback occurs.
The MACD histogram also indicates a bullish shift, as the MACD line (blue) has crossed above the signal line (orange), suggesting an increase in upward momentum. This crossover, along with a steadily rising histogram, points to a potential continuation of the upward movement.
However, it’s important to note that the pair is approaching resistance near the 1.3650 level, which has previously acted as a strong psychological and technical barrier. If USD/CAD manages to break and sustain above this level, it could open the door for further gains, with the next key resistance zone around 1.3800.
USD/CAD daily chart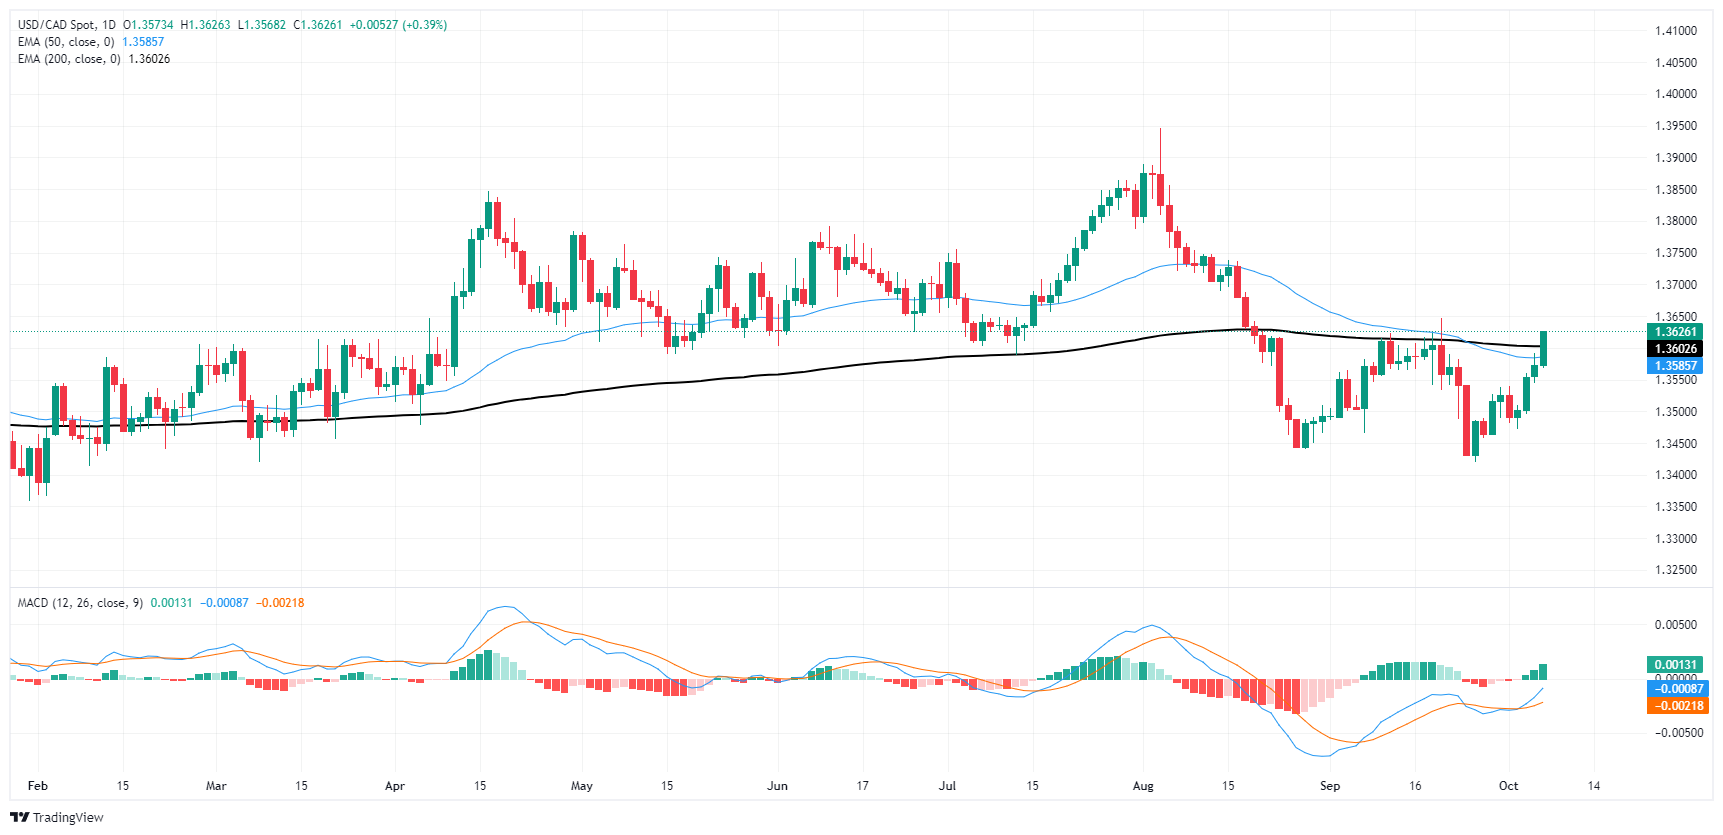
Fed FAQs
Monetary policy in the US is shaped by the Federal Reserve (Fed). The Fed has two mandates: to achieve price stability and foster full employment. Its primary tool to achieve these goals is by adjusting interest rates. When prices are rising too quickly and inflation is above the Fed’s 2% target, it raises interest rates, increasing borrowing costs throughout the economy. This results in a stronger US Dollar (USD) as it makes the US a more attractive place for international investors to park their money. When inflation falls below 2% or the Unemployment Rate is too high, the Fed may lower interest rates to encourage borrowing, which weighs on the Greenback.
The Federal Reserve (Fed) holds eight policy meetings a year, where the Federal Open Market Committee (FOMC) assesses economic conditions and makes monetary policy decisions. The FOMC is attended by twelve Fed officials – the seven members of the Board of Governors, the president of the Federal Reserve Bank of New York, and four of the remaining eleven regional Reserve Bank presidents, who serve one-year terms on a rotating basis.
In extreme situations, the Federal Reserve may resort to a policy named Quantitative Easing (QE). QE is the process by which the Fed substantially increases the flow of credit in a stuck financial system. It is a non-standard policy measure used during crises or when inflation is extremely low. It was the Fed’s weapon of choice during the Great Financial Crisis in 2008. It involves the Fed printing more Dollars and using them to buy high grade bonds from financial institutions. QE usually weakens the US Dollar.
Quantitative tightening (QT) is the reverse process of QE, whereby the Federal Reserve stops buying bonds from financial institutions and does not reinvest the principal from the bonds it holds maturing, to purchase new bonds. It is usually positive for the value of the US Dollar.
Author

Joshua Gibson
FXStreet
Joshua joins the FXStreet team as an Economics and Finance double major from Vancouver Island University with twelve years' experience as an independent trader focusing on technical analysis.