Canadian Dollar churns in the middle ground amidst thin holiday Wednesday markets
- Canadian Dollar trades tightly during the mid-week market session.
- Canada relegated to strictly mid-tier data releases for the rest of the week.
- BoC Summary of Deliberations delivers little new, but reiterates widening policy divergence.

The Canadian Dollar (CAD) is treading water on Wednesday, trading within a scant tenth of a percent against its largest peer — the US Dollar (USD). US markets are shuttered for the midweek Juneteenth holiday, thinning out market volumes as investors look ahead to key data prints on Friday.
Canada has only mid-tier data releases on the docket for the remainder of the trading week. Wednesday’s latest Summary of Deliberations from the Bank of Canada (BoC) delivered no major revelations, as expected. With US markets shuttered for the holiday, trading volumes are thin and investors will be returning to the fold in force to hunker down and wait for Friday’s US Purchasing Managers Index (PMI) print.
Daily digest market movers: Canadian Dollar treads water on quiet Wednesday
- The Canadian Dollar has been on a slow grind this week, finding thin gains against the Greenback. From the week's opening bids, the CAD is up a scant fifth of a percent against the USD.
- The BoC’s Summary of Deliberations, released midway through the US Wednesday session, didn't bring any new details to the BoC’s policy stance, though Governing Council concerns about reigniting inflation have surfaced.
- BoC Summary of Deliberations acknowledges widening divergence with US on policy
- Risk appetite is stubbornly holding on balance as investors brush off a wave of cautious talking points from Federal Reserve (Fed) officials this week. Policymakers still want to see more signs of cooling inflation in the US before committing to even discussing rate cuts.
- Interest rate markets are still staunchly committed to hopes for a September rate cut. According to the CME’s FedWatch tool, rate traders are pricing in nearly 70% odds of at least a quarter-point rate trim from the Federal Open Market Committee (FOMC) at the September 18 meeting.
- Before Friday’s US PMI print, Thursday will deliver a week-on-week update to US Initial Jobless Claims, a popular bellwether for near-term economic performance.
Canadian Dollar PRICE Today
The table below shows the percentage change of Canadian Dollar (CAD) against listed major currencies today. Canadian Dollar was the strongest against the New Zealand Dollar.
| USD | EUR | GBP | JPY | CAD | AUD | NZD | CHF | |
|---|---|---|---|---|---|---|---|---|
| USD | -0.07% | -0.09% | 0.06% | -0.04% | -0.23% | 0.20% | -0.01% | |
| EUR | 0.07% | -0.03% | 0.14% | 0.02% | -0.15% | 0.28% | 0.06% | |
| GBP | 0.09% | 0.03% | 0.16% | 0.05% | -0.13% | 0.31% | 0.10% | |
| JPY | -0.06% | -0.14% | -0.16% | -0.10% | -0.28% | 0.15% | -0.05% | |
| CAD | 0.04% | -0.02% | -0.05% | 0.10% | -0.18% | 0.25% | 0.05% | |
| AUD | 0.23% | 0.15% | 0.13% | 0.28% | 0.18% | 0.44% | 0.24% | |
| NZD | -0.20% | -0.28% | -0.31% | -0.15% | -0.25% | -0.44% | -0.21% | |
| CHF | 0.01% | -0.06% | -0.10% | 0.05% | -0.05% | -0.24% | 0.21% |
The heat map shows percentage changes of major currencies against each other. The base currency is picked from the left column, while the quote currency is picked from the top row. For example, if you pick the Canadian Dollar from the left column and move along the horizontal line to the US Dollar, the percentage change displayed in the box will represent CAD (base)/USD (quote).
Technical analysis: Canadian Dollar churns in place on Wednesday, USD/CAD finds a floor at 1.3700
The Canadian Dollar (CAD) is trading thin on Wednesday, holding close to flat against the Greenback and stuck within a fifth of a percent across the major currency board. USD/CAD eased back to the 1.3700 handle before finding a floor in the midweek markets session, but the pair is trading into the low side of median bids at the 200-hour Exponential Moving Average (EMA) near 1.3725.
Despite a lack of near-term momentum, the CAD is slowly grinding out thin gains against the US Dollar. The USD/CAD has closed flat or down for all but one of the last seven straight trading days, and Wednesday is firmly on pace to chalk in an eighth. The pair is still holding on the high side of the 50-day EMA at 1.3675 and remains trapped in bull country above the 200-day EMA at 1.3578.
USD/CAD hourly chart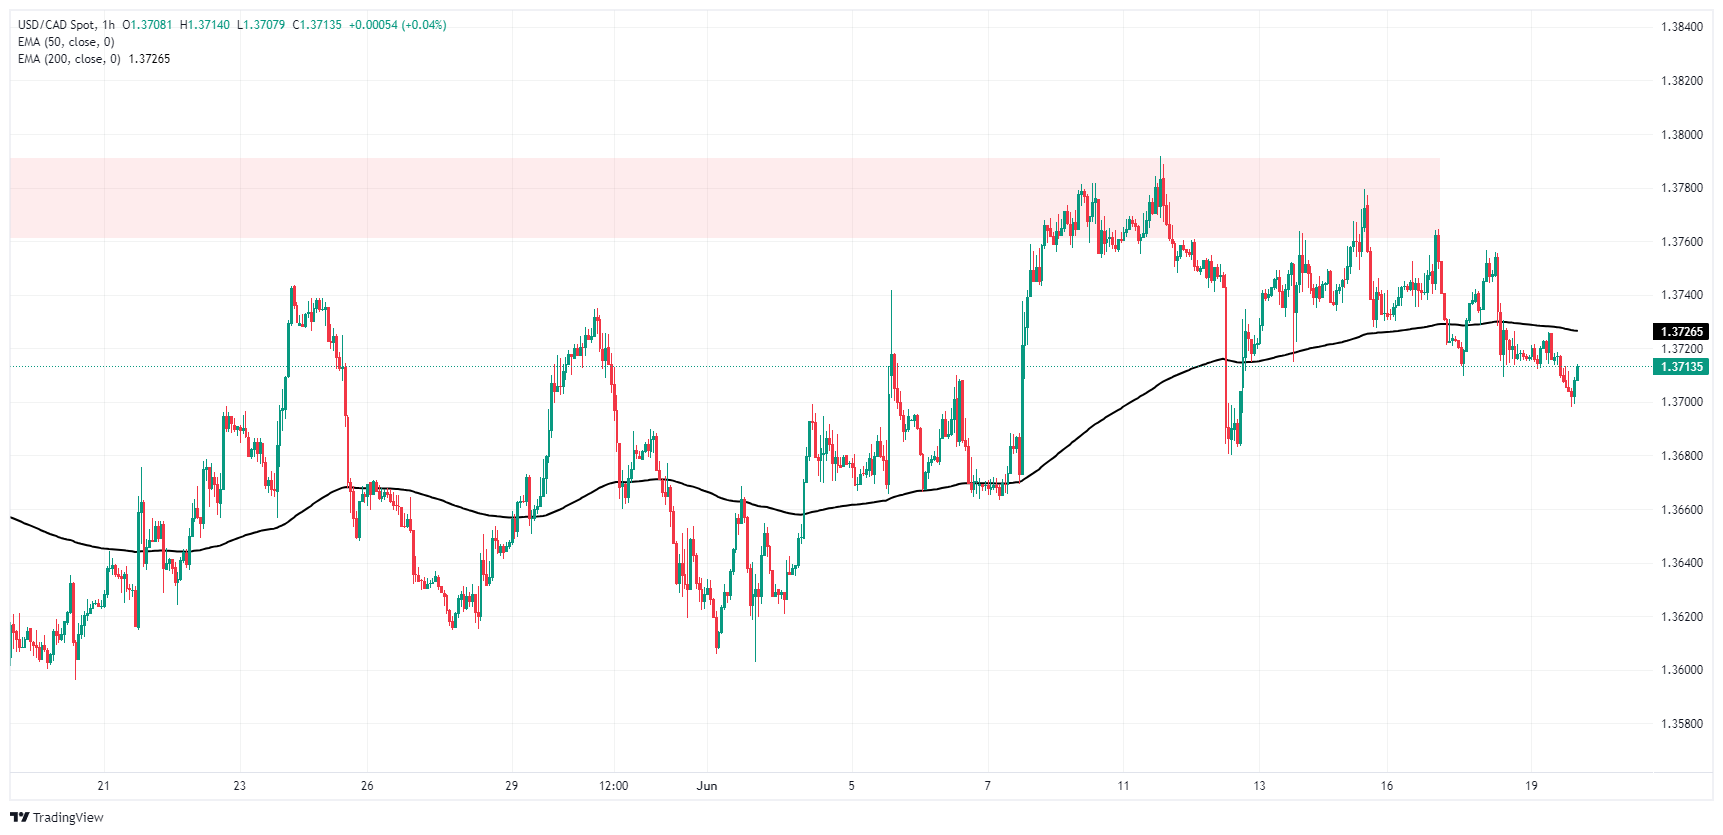
USD/CAD daily chart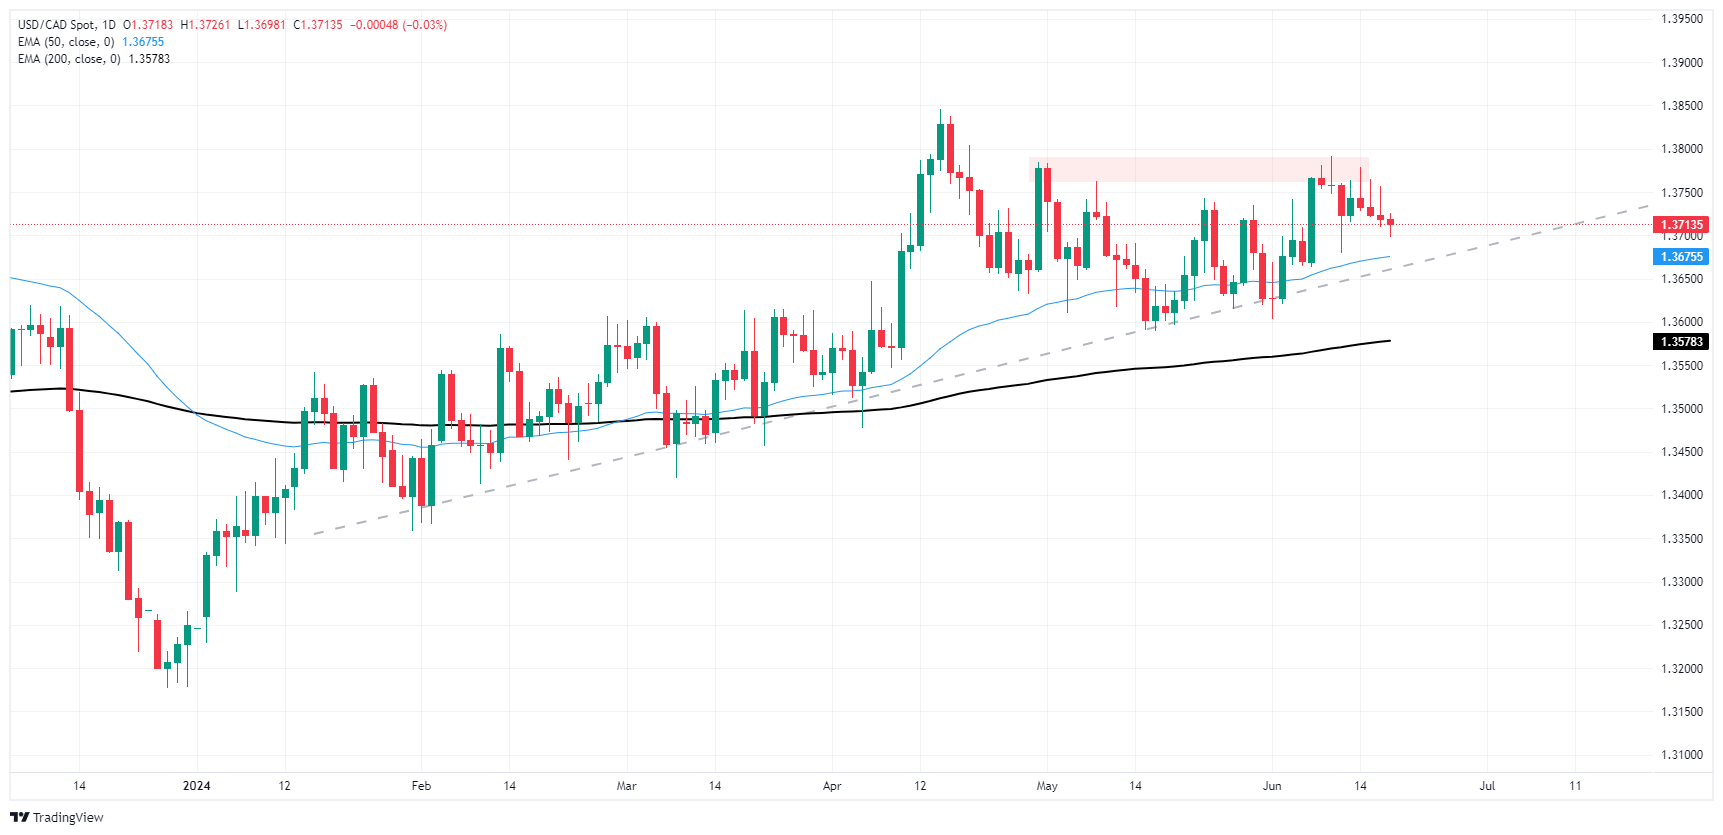
Economic Indicator
Retail Sales (MoM)
The Retail Sales data, released by Statistics Canada on a monthly basis, measures the total value of goods sold by retailers in Canada based on a sampling of retail stores of different types and sizes. Changes in Retail Sales are widely followed as an indicator of consumer spending. Percent changes reflect the rate of changes in such sales, with the MoM reading comparing sales values in the reference month with the previous month. Generally, a high reading is seen as bullish for the Canadian Dollar (CAD), while a low reading is seen as bearish.
Read more.Next release: Fri Jun 21, 2024 12:30
Frequency: Monthly
Consensus: 0.7%
Previous: -0.2%
Source: Statistics Canada
Author

Joshua Gibson
FXStreet
Joshua joins the FXStreet team as an Economics and Finance double major from Vancouver Island University with twelve years' experience as an independent trader focusing on technical analysis.