Canadian Dollar churns chart paper as markets await BoC rate call
- The Canadian Dollar spun in place on Tuesday.
- Bank of Canada rate call looms large on Wednesday.
- The CAD is down roughly 3% against the Greenback since late September.

The Canadian Dollar (CAD) churned chart paper on Tuesday as Loonie traders shuffle in place ahead of the Bank of Canada’s (BoC) impending rate cut due during the midweek market session. Investors broadly expect the BoC to trim interest rates by a further 50 bps on Wednesday, which could further kick the legs out from beneath CAD traders.
Canada saw another decline in raw materials and industrial prices as inflation continues to drain out of the slowing Canadian economy. Despite handily defeating most aspects of inflation in 2024, the BoC is heading for a rocky patch as the Canadian economy lurches toward an economic slowdown at a faster pace than many anticipated at the beginning of the year.
Daily digest market movers
- The Canadian Dollar found a reprieve from recent weakness against the US Dollar on Tuesday, trading within a tight tenth of a percent range.
- The BoC is widely expected to deliver a 50 bps rate cut on Wednesday to combat a lagging economic landscape.
- The BoC’s main reference rate hit a 23-year high of 5.0% mid-2023.
- The BoC has already cut interest rates 75 bps since June of 2024, bringing the current rate down to 4.25%.
- The Canadian Raw Material Price Index declined another 3.1% in September, missing the forecast -1.7% and matching the previous month’s -3.1%.
- Canadian Industrial Produce Prices and declined another 0.6% MoM in September, worse than the forecast -0.5% but recovering slightly from August’s -0.8% contraction.
Canadian Dollar price forecast
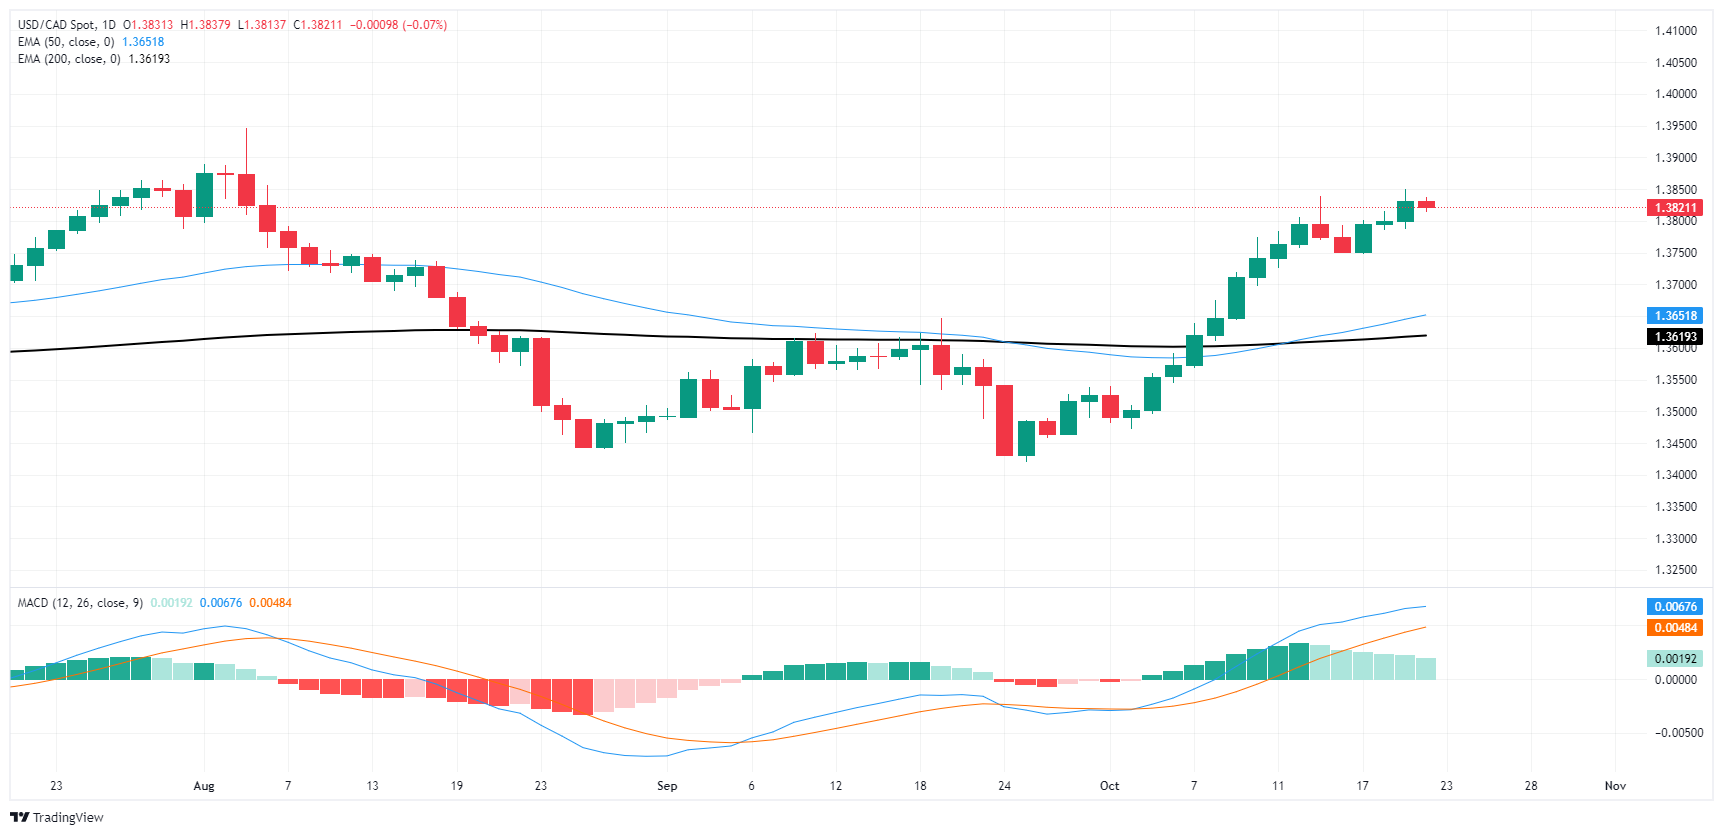
The USD/CAD pair has recently shown a strong recovery after bouncing off the 200-day exponential moving average (EMA) near 1.3619, with the price currently consolidating around the 1.3820 mark. The upward momentum was driven by a series of higher lows that followed the late September bottom. The 50-day EMA at 1.3651 has also turned upward, providing additional support for the bullish trend. While the recent price action shows signs of consolidation, the underlying trend remains positive as long as the pair holds above the 50-day EMA.
Momentum indicators, particularly the MACD, confirm this bullish sentiment. The MACD line remains above the signal line, although the histogram has started to show a slight decrease, suggesting a possible slowdown in bullish momentum. A breakout above the psychological level of 1.3850 could open the door to further upside, targeting the 1.3900 region. However, if the pair breaks below the 50-day EMA, it may indicate a deeper retracement, with 1.3650 acting as the first line of defense for buyers. Traders should watch for a potential breakout or a pullback to confirm the next directional move.
USD/CAD daily chart
Bank of Canada FAQs
The Bank of Canada (BoC), based in Ottawa, is the institution that sets interest rates and manages monetary policy for Canada. It does so at eight scheduled meetings a year and ad hoc emergency meetings that are held as required. The BoC primary mandate is to maintain price stability, which means keeping inflation at between 1-3%. Its main tool for achieving this is by raising or lowering interest rates. Relatively high interest rates will usually result in a stronger Canadian Dollar (CAD) and vice versa. Other tools used include quantitative easing and tightening.
In extreme situations, the Bank of Canada can enact a policy tool called Quantitative Easing. QE is the process by which the BoC prints Canadian Dollars for the purpose of buying assets – usually government or corporate bonds – from financial institutions. QE usually results in a weaker CAD. QE is a last resort when simply lowering interest rates is unlikely to achieve the objective of price stability. The Bank of Canada used the measure during the Great Financial Crisis of 2009-11 when credit froze after banks lost faith in each other’s ability to repay debts.
Quantitative tightening (QT) is the reverse of QE. It is undertaken after QE when an economic recovery is underway and inflation starts rising. Whilst in QE the Bank of Canada purchases government and corporate bonds from financial institutions to provide them with liquidity, in QT the BoC stops buying more assets, and stops reinvesting the principal maturing on the bonds it already holds. It is usually positive (or bullish) for the Canadian Dollar.
Author

Joshua Gibson
FXStreet
Joshua joins the FXStreet team as an Economics and Finance double major from Vancouver Island University with twelve years' experience as an independent trader focusing on technical analysis.


