AUD/USD slips as US CPI dents 50-bps Fed cut
- AUD/USD pulls back as US CPI report indicates core inflation steady at 3.2% YoY, dampening prospects for a 50-bps Fed rate cut.
- Money market futures now forecast an 85% likelihood of a 25-bps rate cut at the next Fed meeting.
- RBA Assistant Governor notes the Australian labor market is tight yet balanced, with the AUD poised for further US data releases this week.

The Australian Dollar dropped during the North American session after the latest US Consumer Price Index (CPI) report, which witnessed an uptick in prices. Market participants that priced in a larger Federal Reserve rate cut trimmed their bets, sponsoring a leg-up in the US Dollar. The AUD/USD trades at 0.6627 after hitting a daily high of 0.6673.
AUD/USD falls to 0.6627 as rising US core inflation dims hopes for larger Fed rate cut
Data from the US Bureau of Labor Statistics (BLS) revealed that August’s headline inflation dipped from 2.9% to 2.6% YoY as expected. Still, the core, which excludes volatile items and is sought as a realistic inflation gauge, stalled at 3.2% YoY. In monthly figures, core CPI edged up from 0.2% to 0.3% while CPI stood at 0,2% MoM.
After the report, money market futures traders slashed the odds for 50 basis points (bps) cut to 15%, while chances for a 25-bps jumped to 85%, via data from the CME FedWatch Tool.
This underpinned the Greenback and weighed on the AUD/USD, which extended its losses to a daily low of 0.6622 before recovering some ground.
In the meantime, the US Dollar Index (DXY), which measures the buck’s performance against six currencies, held to minuscule gains of 0.02% at 10168.
Earlier in the Asian session, Reserve Bank of Australia (RBA) Assistant Governor Sarah Hunter delivered hawkish-tilted remarks, saying the labor market remains tight relative to full employment, but has moved into better balance since late 2022. Hunted stated the economy is moving through a turning point.
What to watch?
The Aussie economic docket will be empty for the remainder of the week. On Thursday, the US schedule will feature the Producer Price Index (PPI) and Initial Jobless Claims for the week ending September 7. On Friday, the University of Michigan Consumer Sentiment is awaited.
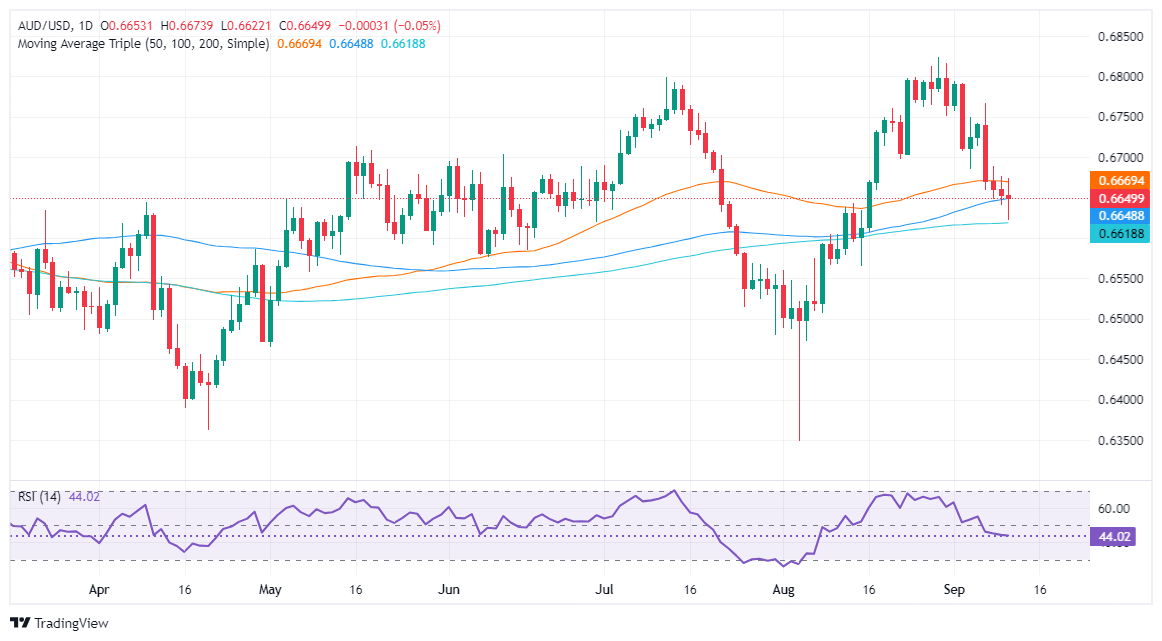
AUD/USD Price Forecast: Technical outlook
The AUD/USD has dropped below the 50- and 100-day moving averages (DMAs) at 0.6667 and 0.6647, opening the door to challenge the 200-DMA at 0.6616. If sellers push prices below the latter, look for further losses. First, they need to crack 0.6600, and the next stop would be the August 15 low of 0.6560.
Conversely, if buyers stepped in and pushed prices above the current week’s peak of 0.6689, look for a test of 0.6700.
Australian Dollar PRICE Today
The table below shows the percentage change of Australian Dollar (AUD) against listed major currencies today. Australian Dollar was the strongest against the British Pound.
| USD | EUR | GBP | JPY | CAD | AUD | NZD | CHF | |
|---|---|---|---|---|---|---|---|---|
| USD | 0.05% | 0.42% | -0.65% | -0.11% | 0.06% | 0.43% | 0.28% | |
| EUR | -0.05% | 0.37% | -0.73% | -0.15% | 0.06% | 0.37% | 0.23% | |
| GBP | -0.42% | -0.37% | -1.14% | -0.53% | -0.37% | 0.00% | -0.14% | |
| JPY | 0.65% | 0.73% | 1.14% | 0.57% | 0.71% | 1.08% | 0.94% | |
| CAD | 0.11% | 0.15% | 0.53% | -0.57% | 0.16% | 0.53% | 0.38% | |
| AUD | -0.06% | -0.06% | 0.37% | -0.71% | -0.16% | 0.30% | 0.23% | |
| NZD | -0.43% | -0.37% | -0.00% | -1.08% | -0.53% | -0.30% | -0.14% | |
| CHF | -0.28% | -0.23% | 0.14% | -0.94% | -0.38% | -0.23% | 0.14% |
The heat map shows percentage changes of major currencies against each other. The base currency is picked from the left column, while the quote currency is picked from the top row. For example, if you pick the Australian Dollar from the left column and move along the horizontal line to the US Dollar, the percentage change displayed in the box will represent AUD (base)/USD (quote).
Author

Christian Borjon Valencia
FXStreet
Markets analyst, news editor, and trading instructor with over 14 years of experience across FX, commodities, US equity indices, and global macro markets.


