|

AUD/USD Price Analysis: Sellers snap two-day uptrend as 21-DMA resistance reigns

  • AUD/USD takes offers to refresh intraday low, prints the first daily loss in three.
  • RBA’s Lowe fails to impress hawks despite citing inflation woes.
  • Failures to cross immediate hurdles, bearish MACD signals favor sellers.
  • Two-month-old ascending support line, 50-DMA challenge further downside.

AUD/USD recalls bears, after a two-day absence, as it renews its intraday low near the mid-0.6900s as the Reserve Bank of Australia (RBA) Governor failed to impress policy hawks in his testimony early Wednesday.

Also read: RBA Lowe: Inflation is way too high, needs to come down

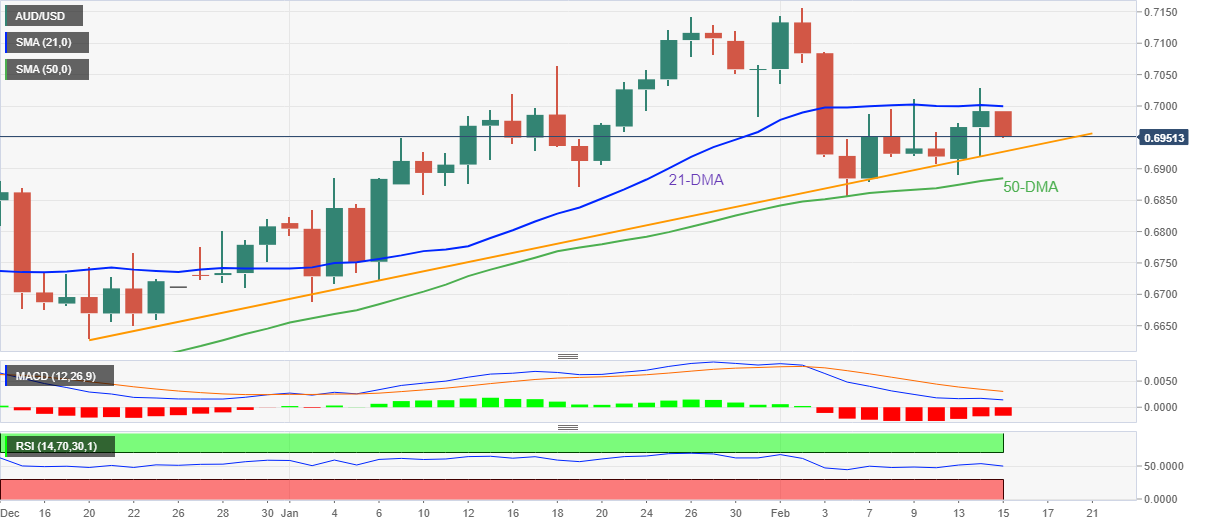
In doing so, AUD/USD takes offers to print the first daily loss in three while reversing from the 21-DMA hurdle. The downside move also gains support from the bearish MACD signals and downbeat RSI (14), not oversold.

It should be noted, however, that an upward-sloping support line from December 20, 2022, close to 0.6930 by the press time, restricts immediate declines of the AUD/USD pair.

Following that, the 50-DMA support of 0.6885 will precede the monthly low of 0.6855 to act as final defenses for the Aussie pair buyers before giving control to the AUD/USD bears.

In that case, the previous monthly low near 0.6730 could gain major attention.

Alternatively, a daily closing beyond the 21-DMA, around the 0.7000 round figure, can propel the AUD/USD prices towards the late January swing high near 0.7065 before highlighting the 0.7100 threshold as the key resistance.

During the quote’s run-up beyond 0.7100, the monthly high of 0.7157 will be crucial to watch as it holds the key to a rally targeting the June 2022 peak surrounding 0.7285.

AUD/USD: Daily chart

Trend: Limited downside expected

Additional important levels

Overview
Today last price0.6954
Today Daily Change-0.0038
Today Daily Change %-0.54%
Today daily open0.6992
 
Trends
Daily SMA200.7002
Daily SMA500.688
Daily SMA1000.6695
Daily SMA2000.6806
 
Levels
Previous Daily High0.703
Previous Daily Low0.6922
Previous Weekly High0.7011
Previous Weekly Low0.6856
Previous Monthly High0.7143
Previous Monthly Low0.6688
Daily Fibonacci 38.2%0.6988
Daily Fibonacci 61.8%0.6963
Daily Pivot Point S10.6932
Daily Pivot Point S20.6873
Daily Pivot Point S30.6824
Daily Pivot Point R10.7041
Daily Pivot Point R20.7089
Daily Pivot Point R30.7149

Author

Anil Panchal

Anil Panchal

FXStreet

Anil Panchal has nearly 15 years of experience in tracking financial markets. With a keen interest in macroeconomics, Anil aptly tracks global news/updates and stays well-informed about the global financial moves and their implications.

More from Anil Panchal
Share:

Markets move fast. We move first.

Orange Juice Newsletter brings you expert driven insights - not headlines. Every day on your inbox.

By subscribing you agree to our Terms and conditions.

Editor's Picks

EUR/USD hovers around 1.1700, US Jobless Claims data eyed

EUR/USD is trading in a range around 1.1700 in European trading on Thursday. The pair's upside remains capped by a pause in the US Dollar decline, led by the less hawkish Fed outcome. Markets await the release of the US weekly Initial Jobless Claims report for further trading incentives. 

GBP/USD struggles below 1.3400 ahead of US employment data

GBP/USD stays defensive below 1.3400 in the European session on Thursday, pressured by a modest US Dollar upswing. Nonetheless, the potential downside might be limited after the US Federal Reserve delivered a rate cut at its December policy meeting. Traders brace for the US weekly Initial Jobless Claims report due later in the day. 

Gold bounces off $4,200 neighborhood, down a little amid mixed fundamental cues

Gold recovers slightly from the vicinity of the $4,200 mark, though it sticks to its negative bias through the first half of the European session. The US Dollar attracts some buyers and recovers a part of the previous day's post-FOMC slump to its lowest level since October 24. This fails to assist the commodity in capitalizing on its modest intraday uptick to the weekly high.

Solana dips as hawkish Fed cuts dampen market sentiment

Solana price is trading below $130 on Thursday, after being rejected at the upper boundary of its falling wedge pattern. The broader market weakness following the Federal Reserve’s hawkish rate cut has added to downside momentum.

Fed projects only 50 bps of additional rate cuts between 2026 and 2027; lifts GDP forecasts

The Federal Open Market Committee’s (FOMC) latest dot plot, released on Wednesday, indicates that interest rates will average 3.4% by the end of 2026, in line with the September projection.

Solana dips as hawkish Fed cuts dampen market sentiment
Solana (SOL) price is trading below $130 at the time of writing on Thursday, after being rejected at the upper boundary of its falling wedge pattern. The broader market weakness following the Federal Reserve’s hawkish rate cut has added to downside momentum.