AUD/USD Price Analysis: Retraces from wall of resistance around 0.6750


  • AUD/USD retreats after refreshing one-week high, mildly bid of late.
  • Bullish MACD signals, upbeat RSI (14) keeps Aussie pair buyers hopeful.
  • Convergence of 200-DMA, monthly triangle’s upper line restrict immediate advances.
  • Bears remain off the table unless breaking 0.6520.

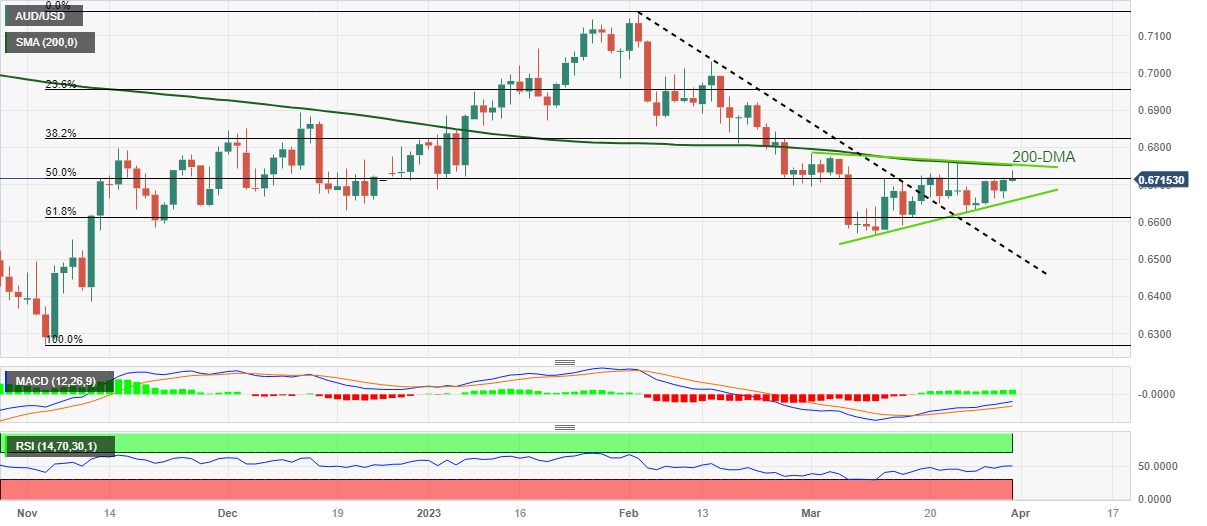
AUD/USD pares intraday gains around 0.6720, following the run-up to refresh weekly top to near 0.6740, as markets brace for the key US inflation clues during early Friday. Even so, the Aussie pair remains inside a monthly symmetrical triangle.

It’s worth noting that upbeat China PMI and broad US Dollar weakness, amid receding hawkish Fed bets, previously propelled the AUD/USD pair to renew a one-week high.

Even if the Aussie pair fades upside momentum ahead of the key data, bullish MACD signals join the above 50 levels of RSI (14), not overbought, to keep the buyers hopeful.

However, the 200-DMA and the stated triangle’s top line, close to 0.6750, appear a tough nut to crack for the AUD/USD bulls to crack.

Following that, a run-up towards the early February lows near 0.6855 and then to the last December’s high of around 0.6895 can’t be ruled out.

On the contrary, pullback moves need to defy the triangle formation, by slipping beneath the support line of 0.6660, to convince AUD/USD bears.

In that case, the 61.8% Fibonacci retracement of the pair’s November-February upside precedes the previous resistance line from February, respectively near 0.6610 and 0.6520, to challenge the AUD/USD sellers afterward.

AUD/USD: Daily chart

Trend: Further upside expected

Additional important levels

Overview
Today last price 0.6719
Today Daily Change 0.0007
Today Daily Change % 0.10%
Today daily open 0.6712
 
Trends
Daily SMA20 0.6666
Daily SMA50 0.6825
Daily SMA100 0.68
Daily SMA200 0.6753
 
Levels
Previous Daily High 0.6718
Previous Daily Low 0.6661
Previous Weekly High 0.6759
Previous Weekly Low 0.6625
Previous Monthly High 0.7158
Previous Monthly Low 0.6698
Daily Fibonacci 38.2% 0.6697
Daily Fibonacci 61.8% 0.6683
Daily Pivot Point S1 0.6676
Daily Pivot Point S2 0.664
Daily Pivot Point S3 0.662
Daily Pivot Point R1 0.6733
Daily Pivot Point R2 0.6754
Daily Pivot Point R3 0.679


Share: Feed news

Information on these pages contains forward-looking statements that involve risks and uncertainties. Markets and instruments profiled on this page are for informational purposes only and should not in any way come across as a recommendation to buy or sell in these assets. You should do your own thorough research before making any investment decisions. FXStreet does not in any way guarantee that this information is free from mistakes, errors, or material misstatements. It also does not guarantee that this information is of a timely nature. Investing in Open Markets involves a great deal of risk, including the loss of all or a portion of your investment, as well as emotional distress. All risks, losses and costs associated with investing, including total loss of principal, are your responsibility. The views and opinions expressed in this article are those of the authors and do not necessarily reflect the official policy or position of FXStreet nor its advertisers. The author will not be held responsible for information that is found at the end of links posted on this page.

If not otherwise explicitly mentioned in the body of the article, at the time of writing, the author has no position in any stock mentioned in this article and no business relationship with any company mentioned. The author has not received compensation for writing this article, other than from FXStreet.

FXStreet and the author do not provide personalized recommendations. The author makes no representations as to the accuracy, completeness, or suitability of this information. FXStreet and the author will not be liable for any errors, omissions or any losses, injuries or damages arising from this information and its display or use. Errors and omissions excepted.

The author and FXStreet are not registered investment advisors and nothing in this article is intended to be investment advice.

Recommended content


Recommended content

Editors’ Picks

EUR/USD stays in positive territory above 1.0850 after US data

EUR/USD stays in positive territory above 1.0850 after US data

EUR/USD clings to modest daily gains above 1.0850 in the second half of the day on Friday. The improving risk mood makes it difficult for the US Dollar to hold its ground after PCE inflation data, helping the pair edge higher ahead of the weekend.

EUR/USD News

GBP/USD stabilizes above 1.2850 as risk mood improves

GBP/USD stabilizes above 1.2850 as risk mood improves

GBP/USD maintains recovery momentum and fluctuates above 1.2850 in the American session on Friday. The positive shift seen in risk mood doesn't allow the US Dollar to preserve its strength and supports the pair.

GBP/USD News

Gold rebounds above $2,380 as US yields stretch lower

Gold rebounds above $2,380 as US yields stretch lower

Following a quiet European session, Gold gathers bullish momentum and trades decisively higher on the day above $2,380. The benchmark 10-year US Treasury bond yield loses more than 1% on the day after US PCE inflation data, fuelling XAU/USD's upside.

Gold News

Avalanche price sets for a rally following retest of key support level

Avalanche price sets for a rally following retest of  key support level

Avalanche (AVAX) price bounced off the $26.34 support level to trade at $27.95 as of Friday. Growing on-chain development activity indicates a potential bullish move in the coming days.

Read more

The election, Trump's Dollar policy, and the future of the Yen

The election, Trump's Dollar policy, and the future of the Yen

After an assassination attempt on former President Donald Trump and drop out of President Biden, Kamala Harris has been endorsed as the Democratic candidate to compete against Trump in the upcoming November US presidential election.

Read more

Forex MAJORS

Cryptocurrencies

Signatures