|

AUD/USD Price Analysis: Refreshes day’s low below 0.7100 amid risk-off mood

  • AUD/USD has refreshed its day’s low at 0.7083 as volatility soars amid the risk-off mood.
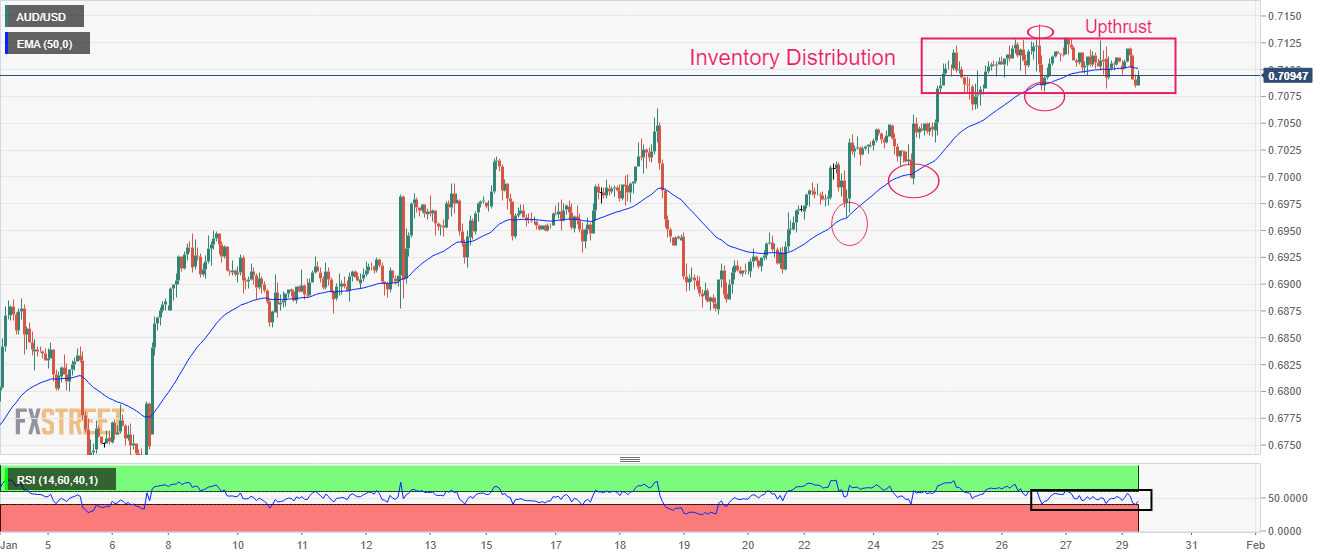
  • The 50-EMA that was providing support to the Australian Dollar is now providing a cushion to the US Dollar.
  • The formation of a Wyckoff Inventory Distribution indicates a bearish reversal.

The AUD/USD pair has refreshed its day’s low at 0.7083 as investors have turned risk-averse amid the interest rate decision by the Federal Reserve (Fed) this week. The US Dollar Index (DXY) has displayed a wild gyration in a 101.40-101.57 range as the volatility is accelerating dramatically.

S&P500 futures have surrendered their entire gains recorded on Friday and is expected to remain on tenterhooks amid a risk-off mood. The 10-year US Treasury yields have dropped below 3.51%.

AUD/USD is demonstrating Wyckoff’s inventory distribution on an hourly scale, which indicates an inventory shift from the institutional investors to the retail participants. The Aussie asset has also witnessed an Upthrust formation that indicates the presence of responsive sellers.

The 50-period Exponential Moving Average (EMA) at 0.7100, which was providing support to the Australian Dollar is now providing cushion to the US Dollar.

While the Relative Strength Index (RSI) (14) is oscillating in a 40.00-60.00 range, which indicates that investors are awaiting a fresh trigger for a power-pack action.

Should the asset break below January 25 low at 0.7062, US Dollar bulls will drag the asset toward the psychological support at 0.7000 followed by January 17 low at 0.6948.

On the contrary, a break above August 11 high at 0.7137 will send the major toward the round-level resistance at 0.7200. A breach of the latter will expose the asset to June 3 high at 0.7283.

On the contrary, a downside move below December 29 low at 0.6710 will drag the major further toward December 22 low at 0.6650 followed by November 21 low at 0.6585.

AUD/USD hourly chart

AUD/USD

Overview
Today last price0.7096
Today Daily Change-0.0012
Today Daily Change %-0.17
Today daily open0.7108
 
Trends
Daily SMA200.6941
Daily SMA500.6816
Daily SMA1000.6656
Daily SMA2000.6812
 
Levels
Previous Daily High0.713
Previous Daily Low0.7082
Previous Weekly High0.7143
Previous Weekly Low0.696
Previous Monthly High0.6893
Previous Monthly Low0.6629
Daily Fibonacci 38.2%0.71
Daily Fibonacci 61.8%0.7111
Daily Pivot Point S10.7084
Daily Pivot Point S20.7059
Daily Pivot Point S30.7036
Daily Pivot Point R10.7131
Daily Pivot Point R20.7154
Daily Pivot Point R30.7178

Author

Sagar Dua

Sagar Dua

FXStreet

Sagar Dua is associated with the financial markets from his college days. Along with pursuing post-graduation in Commerce in 2014, he started his markets training with chart analysis.

More from Sagar Dua
Share:

Editor's Picks

EUR/USD holds above 1.1750 after mixed EU PMI data

EUR/USD manages to hold above 1.1750 but struggles to gather recovery momentum on Friday, following the mixed February PMI figures from Germany and the Eurozone. In the second half of the day, Q4 GDP, December inflation and February PMI data from the US will be watched closely by market participants.

GBP/USD recovers further toward 1.3500 after UK PMI data

GBP/USD is recovering ground further toward 1.3500 in European trading on Friday, helped by a modest uptick in the Pound Sterling after stronger-than-expected UK January Retail Sales and February PMI data. However, the pair's further upside could be limited amid persistent US Dollar strength as the focus turns to key US data. 

Gold sticks to positive bias above $5,000 ahead of US data

Gold gains some positive traction for the third consecutive day on Friday. holding above $5,000. Traders now look forward to the key US macro releases – the Advance Q4 GDP report and the Personal Consumption Expenditures (PCE) Price Index – for fresh trading impetus. 

US GDP growth expected to slow down significantly in Q4 after stellar Q3 

The United States Bureau of Economic Analysis will publish the first preliminary estimate of the fourth-quarter Gross Domestic Product at 13:30 GMT. Analysts forecast the US economy to have expanded at a 3% annualized rate, slowing down from the 4.4% growth posted in the previous quarter.

Iran tensions and AI fears at the forefront ahead of key US data

Thursday’s scorecard shows major US Stock benchmarks closed modestly in the red amid mounting US-Iran tensions and AI disruption worries. The S&P 500 shed 19 points (0.3%) to 6,861, the Nasdaq 100 lost 101 points (0.4%) to 24,797, and the Dow Jones Industrial Average dropped 267 points (0.5%) to 49,395.

Official Trump price approaches breakout with mixed signals from traders

Official Trump (TRUMP) is trading at $3.50 at the time of writing, approaching its upper consolidation range. A breakout from this range could open the door for an upside move. On-chain data shows market indecision, with balanced flows between bulls and bears, signaling a lack of clear directional bias.