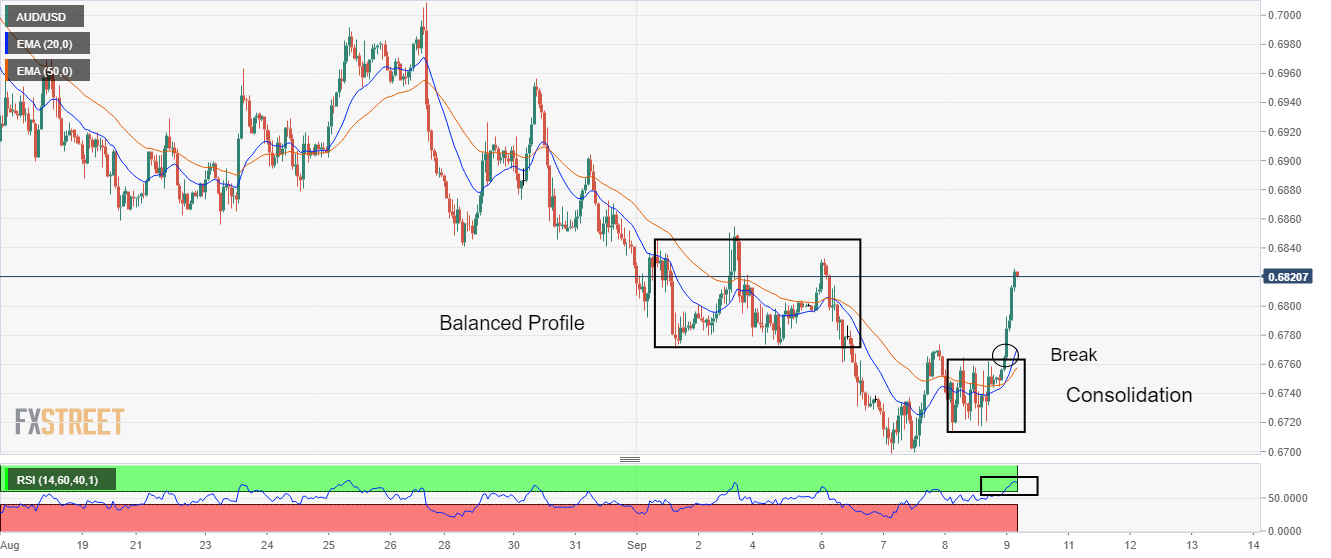
- Aussie bulls have strengthened after an upside break of the 0.6713-0.6770 range.
- A step into the prior balance profile has bolstered the odds of a bullish reversal.
- The RSI (14) has shifted into the bullish range of 60.00-80.00.
The AUD/USD pair is advancing sharply higher after establishing above the critical resistance of 0.6770 in the Asian session. The asset has witnessed a bullish open test-rive session in which bulls remain in control right after defending the downside bias in from the first tick. Also, the major has given an upside break of the consolidation formed in a 0.6713-0.6770 range.
On an hourly scale, the aussie bulls have stepped into the prior balanced profile (placed in a 0.6770-0.6850 range), which resulted in a bearish imbalance. Investors should be aware of the fact that an entry into the prior balanced auction bolsters the odds of a bullish reversal.
The 20-and 50-period Exponential Moving Averages (EMAs) have delivered a bullish crossover at 0.6747, which indicates more upside ahead.
Also, the Relative Strength Index (RSI) (14) has shifted into the bullish range of 60.00-80.00, which dictated that upside momentum has been triggered.
A minor corrective move towards the round-level support at 0.6800 will trigger a bargain buy opportunity for investors, which will drive the asset towards August 29 low at 0.6841, followed by August 31 high at 0.6904.
Alternatively, the antipodean could lose momentum if the asset drops below Thursday’s low at 0.6713. An occurrence of the same will drag the asset towards 6 March 2020 high at 0.6657 and the 27 April 2020 high at 0.6570.
AUD/USD hourly chart
Information on these pages contains forward-looking statements that involve risks and uncertainties. Markets and instruments profiled on this page are for informational purposes only and should not in any way come across as a recommendation to buy or sell in these assets. You should do your own thorough research before making any investment decisions. FXStreet does not in any way guarantee that this information is free from mistakes, errors, or material misstatements. It also does not guarantee that this information is of a timely nature. Investing in Open Markets involves a great deal of risk, including the loss of all or a portion of your investment, as well as emotional distress. All risks, losses and costs associated with investing, including total loss of principal, are your responsibility. The views and opinions expressed in this article are those of the authors and do not necessarily reflect the official policy or position of FXStreet nor its advertisers. The author will not be held responsible for information that is found at the end of links posted on this page.
If not otherwise explicitly mentioned in the body of the article, at the time of writing, the author has no position in any stock mentioned in this article and no business relationship with any company mentioned. The author has not received compensation for writing this article, other than from FXStreet.
FXStreet and the author do not provide personalized recommendations. The author makes no representations as to the accuracy, completeness, or suitability of this information. FXStreet and the author will not be liable for any errors, omissions or any losses, injuries or damages arising from this information and its display or use. Errors and omissions excepted.
The author and FXStreet are not registered investment advisors and nothing in this article is intended to be investment advice.
Recommended content
Editors’ Picks
AUD/USD regains the constructive outlook above the 200-day SMA

AUD/USD advanced strongly for the second session in a row, this time extending the recovery to the upper 0.6500s and shifting its focus to the weekly highs in the 0.6580-0.6585 band, an area coincident with the 100-day SMA.
EUR/USD keeps the bullish performance above 1.0700

The continuation of the sell-off in the Greenback in the wake of the FOMC gathering helped EUR/USD extend its bounce off Wednesday’s lows near 1.0650, advancing past the 1.0700 hurdle ahead of the crucial release of US NFP on Friday.
Gold stuck around $2,300 as market players lack directional conviction

Gold extended its daily slide and dropped below $2,290 in the second half of the day on Thursday. The benchmark 10-year US Treasury bond yield erased its daily losses after US data, causing XAU/USD to stretch lower ahead of Friday's US jobs data.
Bitcoin price rises 5% as BlackRock anticipates a new wave of capital inflows into BTC ETFs from investors

Bitcoin (BTC) price slid to the depths of $56,552 on Wednesday as the cryptocurrency market tried to front run the Federal Open Market Committee (FOMC) meeting. The flash crash saw millions in positions get liquidated.
FOMC in the rear-view mirror – NFP eyed

The update from May’s FOMC rate announcement proved more dovish than expected, which naturally weighed on the US dollar (sending the DXY to lows of 105.44) and US yields, as well as, initially at least, underpinning major US equity indices.