|

AUD/USD Price Analysis: Bulls keep 0.6960 on radar despite mixed China inflation

  • AUD/USD grinds higher even as China CPI improved but PPI eased for December.
  • Successful trading above 200-DMA, previous resistance line from June favor bulls.
  • Two-month-old ascending trend line lures buyers amid bullish MACD signals.

AUD/USD seesaws around the intraday high near 0.6925 even as China prints mixed inflation data for December during early Thursday. In doing so, the Aussie pair extends the previous day’s gains while staying firmer around the highest levels since late August 2022, marked earlier in the week.

That said, China’s headline Consumer Price Index (CPI) grew 1.8% YoY versus 1.8% expected and 1.6% prior whereas the Producer Price Index (PPI) marked -0.7% YoY figures compared to -1.3% previous readings and -0.1% market forecasts.

In addition to the mostly firmer data from Australia’s biggest customer China, the AUD/USD pair’s ability to defend the previous week’s upside break of the 200-DMA and a downward-sloping trend line from June, respectively around 0.6830 and 0.6815, also favor the bulls.

Additionally, keeping the AUD/USD pair on the buyer’s radar are the bullish MACD signals.

As a result, the Aussie pair is well-set to poke a two-month-old ascending resistance line, around 0.6960 at the latest. However, the late August 2022 top surrounding the 0.7000 psychological magnet could challenge the AUD/USD bulls afterward.

Alternatively, AUD/USD downside remains elusive beyond the 0.6815 level comprising the previous resistance line.

Following that, the monthly low of 0.6687 and June 2022 bottom close to 0.6680 could lure the AUD/USD bears before the previous monthly trough surrounding 0.6630.

AUD/USD: Daily chart

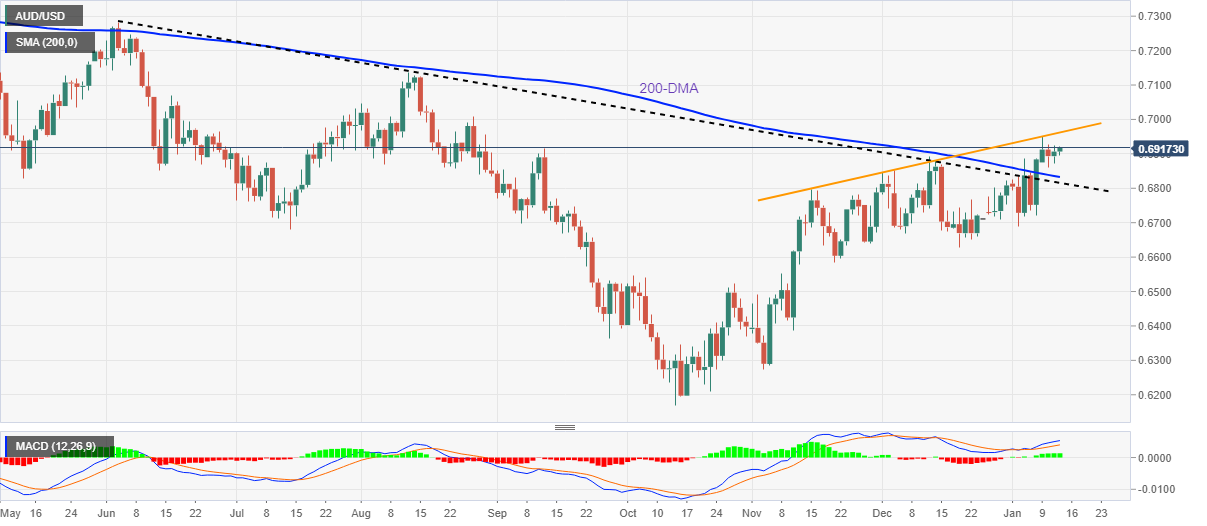
Trend: Further upside expected

Additional important levels

Overview
Today last price0.6914
Today Daily Change0.0007
Today Daily Change %0.10%
Today daily open0.6907
 
Trends
Daily SMA200.6767
Daily SMA500.6715
Daily SMA1000.6635
Daily SMA2000.6836
 
Levels
Previous Daily High0.6926
Previous Daily Low0.6873
Previous Weekly High0.6887
Previous Weekly Low0.6688
Previous Monthly High0.6893
Previous Monthly Low0.6629
Daily Fibonacci 38.2%0.6906
Daily Fibonacci 61.8%0.6893
Daily Pivot Point S10.6878
Daily Pivot Point S20.6849
Daily Pivot Point S30.6825
Daily Pivot Point R10.6931
Daily Pivot Point R20.6954
Daily Pivot Point R30.6983

Author

Anil Panchal

Anil Panchal

FXStreet

Anil Panchal has nearly 15 years of experience in tracking financial markets. With a keen interest in macroeconomics, Anil aptly tracks global news/updates and stays well-informed about the global financial moves and their implications.

More from Anil Panchal
Share:

Markets move fast. We move first.

Orange Juice Newsletter brings you expert driven insights - not headlines. Every day on your inbox.

By subscribing you agree to our Terms and conditions.

Editor's Picks

EUR/USD recovers to 1.1750 region as 2025 draws to a close

Following the bearish action seen in the European session on Wednesday, EUR/USD regains its traction and recovery to the 1.1750 region. Nevertheless, the pair's volatility remains low as trading conditions thin out on the last day of the year.

GBP/USD stays weak near 1.3450 on modest USD recovery

GBP/USD remains under modest beairsh pressure and fluctuates at around 1.3450 on Wednesday. The US Dollar finds fresh demand due to the end-of-the-year position adjustments, weighing on the pair amid the pre-New Year trading lull. 

Gold retreats to $4,300 area, looks to post monthly gains

Gold stays on the back foot on the last day of 2025 and trades near $4,300, possibly pressured by profit-taking and position adjustments. Nevertheless, XAU/USD remains on track to post gains for December and extend its winning streak into a fifth consecutive month.

Bitcoin, Ethereum and XRP prepare for a potential New Year rebound

Bitcoin, Ethereum, and Ripple are holding steady on Wednesday after recording minor gains on the previous day. Technically, Bitcoin could extend gains within a triangle pattern while Ethereum and Ripple face critical overhead resistance. 

Economic outlook 2026-2027 in advanced countries: Solidity test

After a year marked by global economic resilience and ending on a note of optimism, 2026 looks promising and could be a year of solid economic performance. In our baseline scenario, we expect most of the supportive factors at work in 2025 to continue to play a role in 2026.

Crypto market outlook for 2026

Year 2025 was volatile, as crypto often is.  Among positive catalysts were favourable regulatory changes in the U.S., rise of Digital Asset Treasuries (DAT), adoption of AI and tokenization of Real-World-Assets (RWA).