|

AUD/USD Price Analysis: Bull flag, upbeat China data and pre-RBA positioning highlight 0.6750 for buyers

  • AUD/USD extends recovery from intraday low within bullish chart formation.
  • China Caixin PMI, Australia TD Securities Inflation came in firmer for May.
  • Sustained trading beyond key moving averages, upbeat RSI hints at confirmation of bullish pattern.
  • Bull flag signals theoretical target of 0.6750, sellers need validation from 200-SMA.

AUD/USD picks up bids to pare intraday losses around 0.6700 as it struggles to cheer upbeat catalysts at home amid early Monday in Europe. In doing so, the Aussie pair portrays the traders’ anxiety ahead of the key Reserve Bank of Australia (RBA) data.

That said, strong US Nonfarm Payrolls (NFP) teased Aussie pair sellers during the week-start trading before the firmer Australia-China data recall the buyers. Earlier in the day, China’s Caixin Services PMI matches 57.1 market forecasts for May versus 56.4 previous readings. Before that, Australia’s TD Securities Inflation rose 0.9% MoM in May versus 0.2%. However, the downbeat prints of the TD Securities Inflation on a YoY basis join a reduction in the nation’s Company Gross Operating Profits for the first quarter (Q1) to prod the bulls.

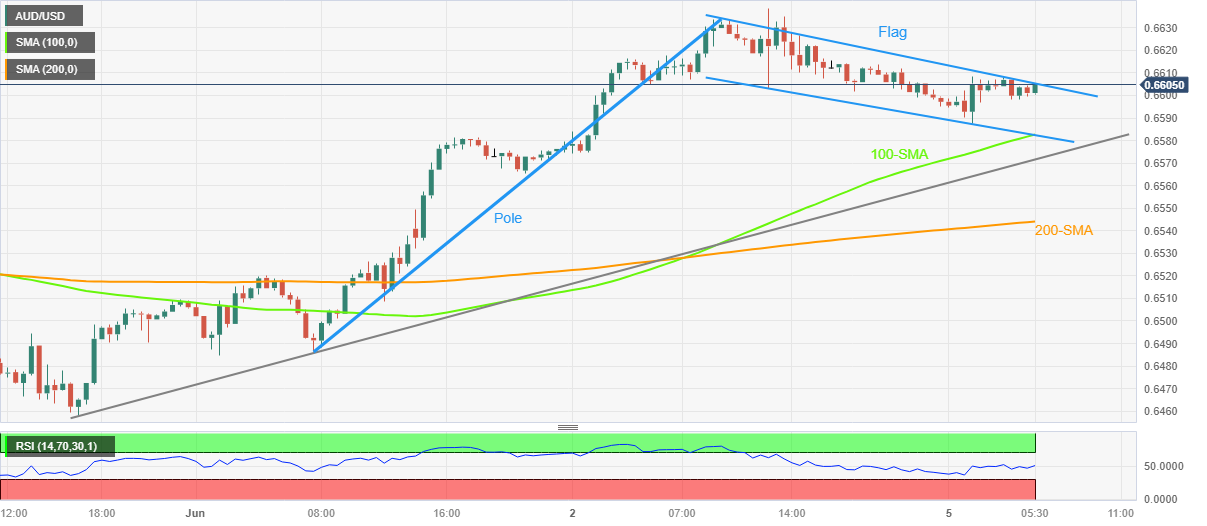
Apart from that, the top line of the short-term bull flag, around 0.67000 round figure by the press time, challenges the AUD/USD pair buyers.

However, the Aussie pair’s successful trading above the 200 and 100 SMAs, as well as a three-day-old rising support line, keeps the pair buyers hopeful of crossing the immediate 0.6700 hurdle, which in turn highlights a theoretical run-up towards the 0.6750 mark.

During the likely rise, highs marked on May 16 and 19, respectively near 0.6710 and 0.6675, can act as intermediate halts.

Meanwhile, 100-SMA joins the stated flag’s bottom line to highlight the 0.6580 level as the short-term key support.

Following that, the ascending support line from the last Wednesday, near 0.6570, followed by the 200-SMA level of near 0.6545, can act as the last defense of the AUD/USD bulls.

AUD/USD: 30-Minutes chart

Trend: Further upside expected

Additional important levels

Overview
Today last price0.6606
Today Daily Change-0.0004
Today Daily Change %-0.06%
Today daily open0.661
 
Trends
Daily SMA200.6626
Daily SMA500.6664
Daily SMA1000.6755
Daily SMA2000.6695
 
Levels
Previous Daily High0.6639
Previous Daily Low0.6565
Previous Weekly High0.6639
Previous Weekly Low0.6458
Previous Monthly High0.6818
Previous Monthly Low0.6458
Daily Fibonacci 38.2%0.6611
Daily Fibonacci 61.8%0.6593
Daily Pivot Point S10.6571
Daily Pivot Point S20.6531
Daily Pivot Point S30.6497
Daily Pivot Point R10.6644
Daily Pivot Point R20.6678
Daily Pivot Point R30.6718

Author

Anil Panchal

Anil Panchal

FXStreet

Anil Panchal has nearly 15 years of experience in tracking financial markets. With a keen interest in macroeconomics, Anil aptly tracks global news/updates and stays well-informed about the global financial moves and their implications.

More from Anil Panchal
Share:

Editor's Picks

EUR/USD eyes nine-day EMA barrier after rebounding from 1.1600

EUR/USD gains ground after registering modest losses in the previous session, trading around 1.1620 during the Asian hours on Friday. The technical analysis of the daily chart suggests an ongoing bearish bias as the pair remains within the descending channel pattern.

GBP/USD: Pound Sterling ticks up against US Dollar in countdown to US NFP

The Pound Sterling trades marginally higher to near 1.3365 against the US Dollar during the Asian trading session on Friday. The GBP/USD pair edges up as the US Dollar ticks down ahead of the United States Nonfarm Payrolls data for February, which will be published at 13:30 GMT.

Gold rises but remains on track for weekly loss in five weeks

Gold price recovers its recent losses from the previous session on Friday. The yellow metal advances as the broader precious metals market rebounds on safe-haven demand. However, the yellow metal is on track for its first weekly decline in five weeks as escalating Middle East tensions push oil prices higher, fueling inflation concerns and reducing bets on Federal Reserve rate cuts.

Bitcoin, Ethereum and Ripple at risk as US-Iran war extends

Bitcoin, Ethereum, and Ripple trade cautiously at press time on Friday, close to key support levels after a roughly 2% pullback the previous day. Bitcoin holds above $71,000, Ethereum at $2,000, and XRP continues to consolidate in a sideways range.

The market compass is pointing at a barrel of Oil

The Asian open is arriving with equities leaning the wrong way, and the reason is not complicated. The market’s compass needle has snapped firmly toward crude. In this tape, oil is not just another input price; it is the gravitational center around which every asset class is orbiting.

Ripple tests recovery strength amid steady ETF inflows, growing retail interest

Ripple (XRP) continues to demonstrate notable resilience as the cryptocurrency market navigates the persistent war in the Middle East after the United States (US) and Israel attacked Iran on Saturday.