|

AUD/USD Price Analysis: Australian Dollar faces heat as market mood sours

  • Investors have turned risk-averse ahead of the US PCE Price Index data.

  • The formation of an Ascending Triangle indicates sheer volatility contraction.

  • The RSI (14) has shifted into the 40.00-60.. range, which indicates an exhaustion in the upside momentum.

The AUD/USD pair has corrected sharply to near 0.7100 in the early European session. The Aussie asset has sensed selling pressure as investors have turned risk averse ahead of the release of the United States Personal Consumption Expenditure (PCE) Price Index data. Meanwhile, an improvement in the safe-haven’s appeal has strengthened the US Dollar Index (DXY).

S&P500 futures has demonstrated a sell-off as further interest rate hikes by the Federal Reserve (Fed) might accelerate recession fears. The 10-year US Treasury yields has added gains further to near 3.53%.

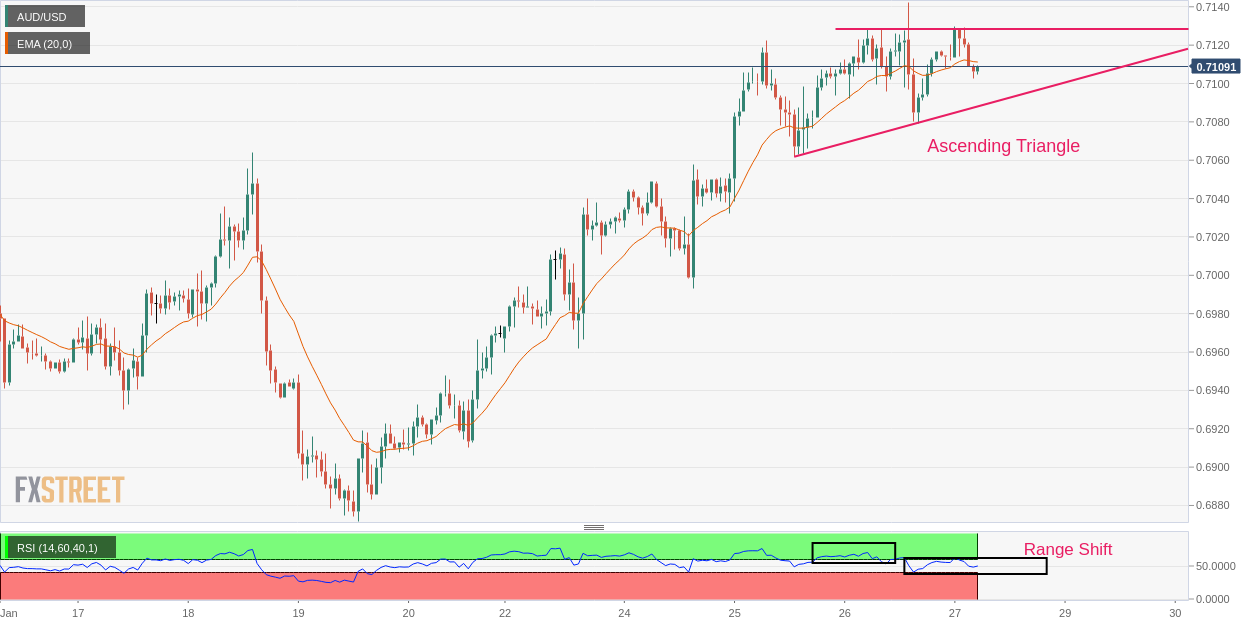
On an hourly scale, AUD/USD is oscillating in an Ascending Triangle chart pattern that indicates a sheer contraction in volatility. The upward-sloping trendline of the chart pattern is plotted from January 25 average price at 0.7061 while the horizontal resistance is placed from January 26 high around 0.7140.

The 20-period Exponential Moving Average (EMA) at 0.7110 has overlapped the asset, which indicates a rangebound acution profile.

It is observed that the Relative Strength Index (RSI) (14) has shifted into the 40.00-60.00 range from the bullish range of 60.00-80.00, which conveys that the bullish momentum has faded now.

Should the asset breaks above January 26 high at 0.7142, Aussie asset will deliver a breakout the Ascending Triangle, which will drive the major towards the round-level resistance of 0.7200. A breach of the latter will expose the asset for more upside toward June 3 high at 0.7283.

On the contrary, a downside move below December 29 low at 0.6710 will drag the major further toward December 22 low at 0.6650 followed by November 21 low at 0.6585.

AUD/USD hourly chart

AUD/USD

Overview
Today last price0.7111
Today Daily Change-0.0005
Today Daily Change %-0.07
Today daily open0.7116
 
Trends
Daily SMA200.6926
Daily SMA500.6808
Daily SMA1000.6653
Daily SMA2000.6813
 
Levels
Previous Daily High0.7143
Previous Daily Low0.7079
Previous Weekly High0.7064
Previous Weekly Low0.6872
Previous Monthly High0.6893
Previous Monthly Low0.6629
Daily Fibonacci 38.2%0.7118
Daily Fibonacci 61.8%0.7103
Daily Pivot Point S10.7083
Daily Pivot Point S20.705
Daily Pivot Point S30.702
Daily Pivot Point R10.7146
Daily Pivot Point R20.7176
Daily Pivot Point R30.7209

Author

Sagar Dua

Sagar Dua

FXStreet

Sagar Dua is associated with the financial markets from his college days. Along with pursuing post-graduation in Commerce in 2014, he started his markets training with chart analysis.

More from Sagar Dua
Share:

Markets move fast. We move first.

Orange Juice Newsletter brings you expert driven insights - not headlines. Every day on your inbox.

By subscribing you agree to our Terms and conditions.

Editor's Picks

EUR/USD rebounds after falling toward 1.1700

EUR/USD gains traction and trades above 1.1730 in the American session, looking to end the week virtually unchanged. The bullish opening in Wall Street makes it difficult for the US Dollar to preserve its recovery momentum and helps the pair rebound heading into the weekend.

GBP/USD steadies below 1.3400 as traders assess BoE policy outlook

Following Thursday's volatile session, GBP/USD moves sideways below 1.3400 on Friday. Investors reassess the Bank of England's policy oıtlook after the MPC decided to cut the interest rate by 25 bps by a slim margin. Meanwhile, the improving risk mood helps the pair hold its ground.

Gold stays below $4,350, looks to post small weekly gains

Gold struggles to gather recovery momentum and stays below $4,350 in the second half of the day on Friday, as the benchmark 10-year US Treasury bond yield edges higher. Nevertheless, the precious metal remains on track to end the week with modest gains as markets gear up for the holiday season.

Crypto Today: Bitcoin, Ethereum, XRP rebound amid bearish market conditions

Bitcoin (BTC) is edging higher, trading above $88,000 at the time of writing on Monday. Altcoins, including Ethereum (ETH) and Ripple (XRP), are following in BTC’s footsteps, experiencing relief rebounds following a volatile week.

How much can one month of soft inflation change the Fed’s mind?

One month of softer inflation data is rarely enough to shift Federal Reserve policy on its own, but in a market highly sensitive to every data point, even a single reading can reshape expectations. November’s inflation report offered a welcome sign of cooling price pressures. 

XRP rebounds amid ETF inflows and declining retail demand demand

XRP rebounds as bulls target a short-term breakout above $2.00 on Friday. XRP ETFs record the highest inflow since December 8, signaling growing institutional appetite.