|

AUD/USD Price Analysis: Auctions below 0.6700 as soften Australian CPI cements steady RBA policy

  • AUD/USD has shifted its business below 0.6700 after the Australian CPI softens consecutively.
  • Subdued retail demand weighed heavily on Australian inflation.
  • The 20-period EMA at 0.6686 is acting as a cushion for the Australian Dollar.

The AUD/USD pair is displaying topsy-turvy moves below the round-level resistance of 0.6700 in the Asian session. The Aussie asset has turned rangebound after a vertical downside move post-softening of the Australian Consumer Price Index (CPI).

Monthly Australian inflation (Fed) softened further to 6.9% from the prior release of 7.4% as households’ spending has trimmed dramatically. Households are struggling in bearing the burden of inflated goods and services with their nominal growth in earnings. This has bolstered the intention of pausing the policy-tightening spell by the Reserve Bank of Australia (RBA) from its April meeting.

Meanwhile, the US Dollar Index (DXY) has shown a firmer recovery from 102.40. The recovery move by the USD Index has escalated to 102.60.

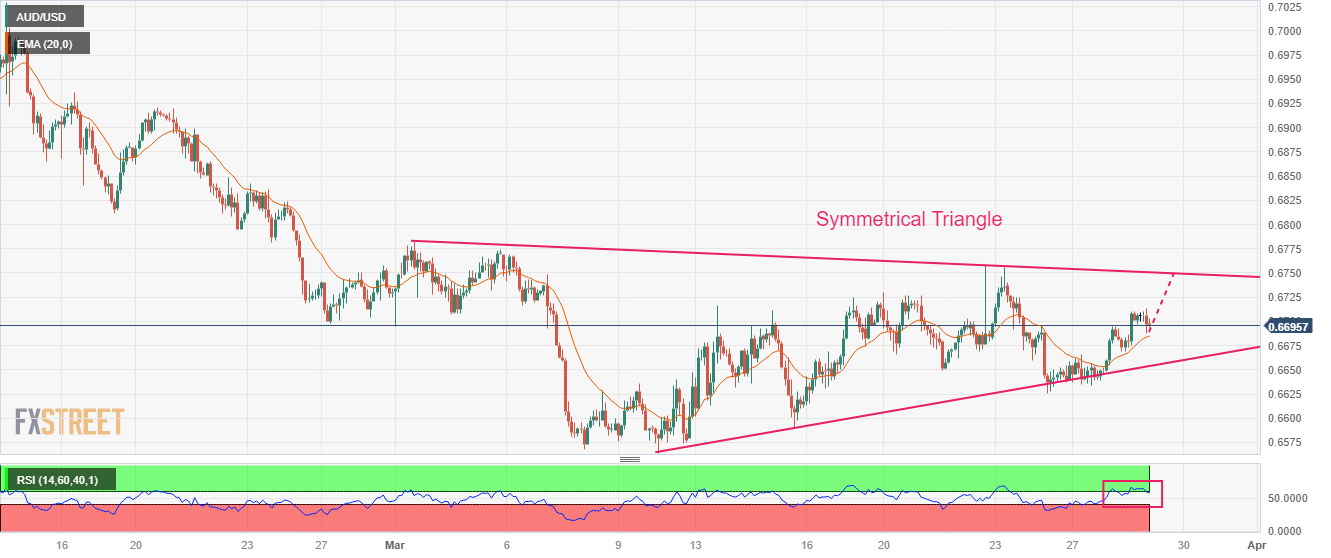
On a two-hour scale, AUD/USD has shown a decent upside after sensing strength near the upward-sloping trendline of the Symmetrical Triangle chart pattern, which is placed from March 10 low at 0.6564. The downward-sloping trendline of the chart pattern is plotted from March 01 high at 0.6784.

The 20-period Exponential Moving Average (EMA) at 0.6686 is acting as a cushion for the Australian Dollar.

In addition to that, the Relative Strength Index (RSI) (14) is making efforts in keeping itself in the bullish range of 60.00-80.00, which will keep the Australian Dollar in the grip of bulls.

Should the asset breaks above March 13 high at 0.6717, Aussie bulls would drive the asset further toward March 07 high at 0.67478 followed by the horizontal resistance plotted from February 23 low at 0.6781.

On the contrary, a slippage below March 15 low at 0.6564 will drag the asset toward October 4 high at 0.6547 and the round-level support at 0.6500.

AUD/USD two-hour chart

AUD/USD

Overview
Today last price0.6696
Today Daily Change-0.0013
Today Daily Change %-0.19
Today daily open0.6709
 
Trends
Daily SMA200.6671
Daily SMA500.6834
Daily SMA1000.6796
Daily SMA2000.6755
 
Levels
Previous Daily High0.671
Previous Daily Low0.6646
Previous Weekly High0.6759
Previous Weekly Low0.6625
Previous Monthly High0.7158
Previous Monthly Low0.6698
Daily Fibonacci 38.2%0.6686
Daily Fibonacci 61.8%0.6671
Daily Pivot Point S10.6666
Daily Pivot Point S20.6624
Daily Pivot Point S30.6602
Daily Pivot Point R10.6731
Daily Pivot Point R20.6753
Daily Pivot Point R30.6795

Author

Sagar Dua

Sagar Dua

FXStreet

Sagar Dua is associated with the financial markets from his college days. Along with pursuing post-graduation in Commerce in 2014, he started his markets training with chart analysis.

More from Sagar Dua
Share:

Markets move fast. We move first.

Orange Juice Newsletter brings you expert driven insights - not headlines. Every day on your inbox.

By subscribing you agree to our Terms and conditions.

Editor's Picks

EUR/USD bears await break below 100-day SMA support near 1.1665 area

The EUR/USD pair attracts heavy selling for the second straight day and dives to a nearly four-week trough, around the 1.1670 region, during the Asian session on Monday. Bearish traders now await a sustained break below the 100-day Simple Moving Average before positioning for an extension of the recent pullback from a three-month top, or levels just above the 1.1800 mark touched on December 24.

GBP/USD falls toward 1.3400 near 50-day EMA

GBP/USD extends its losses for the second successive session, trading around 1.3420 during the Asian hours on Monday. The technical analysis of the daily chart indicates that the 14-day Relative Strength Index at 53 has eased from near overbought, indicating that momentum has cooled while remaining above the midline. RSI holds above 50, keeping a modest bullish bias.

Gold on fire at the start of the week on US-Venezuela tensions

Gold regains upside traction early Monday as flight to safety prevails on Venezuela turmoil. The US Dollar finds strong haven demand, caps Gold’s upside as focus shifts to US jobs data. Gold’s daily technical setup suggests that more upside remains in the offing.

Bulls firmly in control as Bitcoin breaks $93K, Ethereum and Ripple extend gains

Bitcoin, Ethereum, and Ripple extended their rallies on Monday, gaining more than 4%, 6%, and 12%, respectively, in the previous week. The top three cryptocurrencies by market capitalization could continue to outperform, with bulls in control of the momentum.

Economic outlook 2026-2027 in advanced countries: Solidity test

After a year marked by global economic resilience and ending on a note of optimism, 2026 looks promising and could be a year of solid economic performance. In our baseline scenario, we expect most of the supportive factors at work in 2025 to continue to play a role in 2026.

Meme Coins Price Prediction: Dogecoin, Shiba Inu, Pepe rally on Venezuela’s shadow BTC reserve

Meme coins such as Dogecoin, Shiba Inu, and Pepe are leading the cryptocurrency market rally driven by the US cross-border operation to capture Venezuelan President Nicolás Maduro. Dogecoin extends its gain for the fifth consecutive day while SHIB and PEPE take a pause.