AUD/USD Price Analysis: Any recovery remains elusive below 0.6705


  • AUD/USD pares the biggest daily loss in a week amid sluggish markets, retreats from daily high of late.
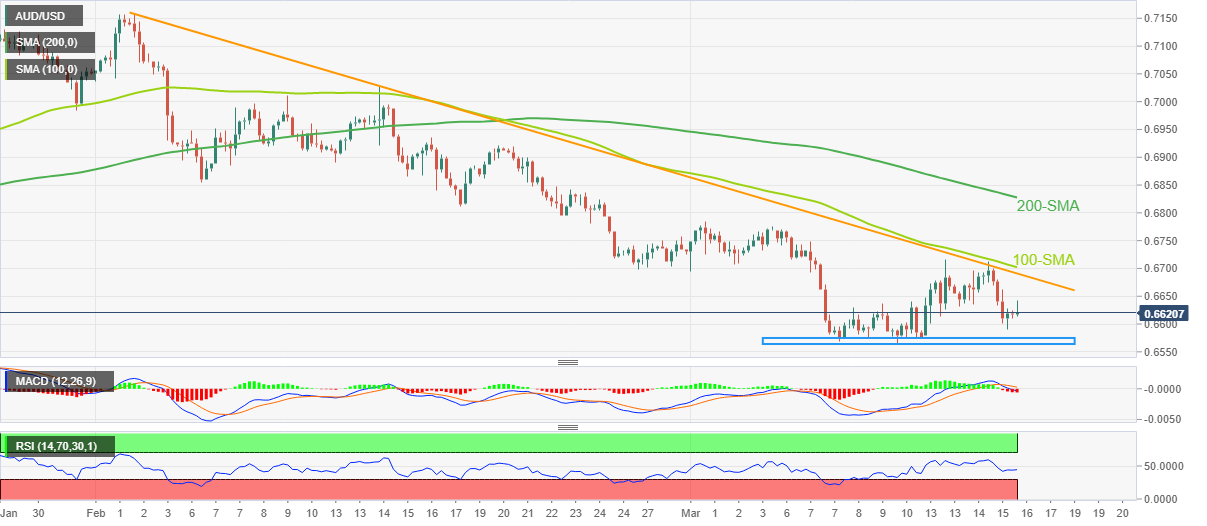
  • Bearish MACD signals, steady RSI suggests a continuation of downtrend.
  • Six-week-old descending resistance line, 100-SMA restrict immediate upside.
  • Aussie bulls remain confused below 200-SMA; one-week-long horizontal support puts a floor under the prices.

AUD/USD struggles to keep the daily gains around 0.6620 as it consolidates the biggest slump in a week during Thursday’s sluggish morning in Europe, after a volatile Wednesday that rocked markets with a risk-off mood.

In doing so, the Aussie pair justifies the bearish MACD signals and RSI (14) line, as well as the repeated failures to cross a 1.5-month-long resistance line and the 100-SMA, to tease the intraday sellers.

However, an area comprising multiple lows marked since March 07, between 0.6565 and 0.6575, appears a tough nut to crack for the AUD/USD bears.

Also acting as the downside filters are the tops marked during October 2022 around 0.6545 and 0.6520.

On the contrary, the aforementioned resistance and the 100-SMA, respectively near 0.6690 and 0.6705, restrict short-term AUD/USD advances amid downbeat oscillators.

Even if the AUD/USD bulls manage to cross the 0.6705 hurdle, the monthly high near 0.6785 and the 0.6800 round figure will precede the 200-SMA resistance of around 0.6830 to challenge the risk-barometer pair’s further upside.

To sum up, AUD/UDS is likely to remain bearish but the road towards the south appears bumpy.

AUD/USD: Four-hour chart

Trend: Further downside expected

Additional important levels

Overview
Today last price 0.6626
Today Daily Change 0.0007
Today Daily Change % 0.11%
Today daily open 0.6619
 
Trends
Daily SMA20 0.6732
Daily SMA50 0.6876
Daily SMA100 0.6773
Daily SMA200 0.6769
 
Levels
Previous Daily High 0.6712
Previous Daily Low 0.659
Previous Weekly High 0.677
Previous Weekly Low 0.6564
Previous Monthly High 0.7158
Previous Monthly Low 0.6698
Daily Fibonacci 38.2% 0.6636
Daily Fibonacci 61.8% 0.6665
Daily Pivot Point S1 0.6569
Daily Pivot Point S2 0.6518
Daily Pivot Point S3 0.6447
Daily Pivot Point R1 0.669
Daily Pivot Point R2 0.6762
Daily Pivot Point R3 0.6812


Share: Feed news

Information on these pages contains forward-looking statements that involve risks and uncertainties. Markets and instruments profiled on this page are for informational purposes only and should not in any way come across as a recommendation to buy or sell in these assets. You should do your own thorough research before making any investment decisions. FXStreet does not in any way guarantee that this information is free from mistakes, errors, or material misstatements. It also does not guarantee that this information is of a timely nature. Investing in Open Markets involves a great deal of risk, including the loss of all or a portion of your investment, as well as emotional distress. All risks, losses and costs associated with investing, including total loss of principal, are your responsibility. The views and opinions expressed in this article are those of the authors and do not necessarily reflect the official policy or position of FXStreet nor its advertisers. The author will not be held responsible for information that is found at the end of links posted on this page.

If not otherwise explicitly mentioned in the body of the article, at the time of writing, the author has no position in any stock mentioned in this article and no business relationship with any company mentioned. The author has not received compensation for writing this article, other than from FXStreet.

FXStreet and the author do not provide personalized recommendations. The author makes no representations as to the accuracy, completeness, or suitability of this information. FXStreet and the author will not be liable for any errors, omissions or any losses, injuries or damages arising from this information and its display or use. Errors and omissions excepted.

The author and FXStreet are not registered investment advisors and nothing in this article is intended to be investment advice.

Recommended content


Recommended content

Editors’ Picks

EUR/USD stays in positive territory above 1.0850 after US data

EUR/USD stays in positive territory above 1.0850 after US data

EUR/USD clings to modest daily gains above 1.0850 in the second half of the day on Friday. The improving risk mood makes it difficult for the US Dollar to hold its ground after PCE inflation data, helping the pair edge higher ahead of the weekend.

EUR/USD News

GBP/USD stabilizes above 1.2850 as risk mood improves

GBP/USD stabilizes above 1.2850 as risk mood improves

GBP/USD maintains recovery momentum and fluctuates above 1.2850 in the American session on Friday. The positive shift seen in risk mood doesn't allow the US Dollar to preserve its strength and supports the pair.

GBP/USD News

Gold rebounds above $2,380 as US yields stretch lower

Gold rebounds above $2,380 as US yields stretch lower

Following a quiet European session, Gold gathers bullish momentum and trades decisively higher on the day above $2,380. The benchmark 10-year US Treasury bond yield loses more than 1% on the day after US PCE inflation data, fuelling XAU/USD's upside.

Gold News

Avalanche price sets for a rally following retest of key support level

Avalanche price sets for a rally following retest of  key support level

Avalanche (AVAX) price bounced off the $26.34 support level to trade at $27.95 as of Friday. Growing on-chain development activity indicates a potential bullish move in the coming days.

Read more

The election, Trump's Dollar policy, and the future of the Yen

The election, Trump's Dollar policy, and the future of the Yen

After an assassination attempt on former President Donald Trump and drop out of President Biden, Kamala Harris has been endorsed as the Democratic candidate to compete against Trump in the upcoming November US presidential election.

Read more

Forex MAJORS

Cryptocurrencies

Signatures