AUD/USD Price Analysis: Absence of recovery signals favors more downside, 0.6500 eyed


Share:
  • AUD/USD is attempting to scale above 0.6600, however, the risk-off mood is still intact.
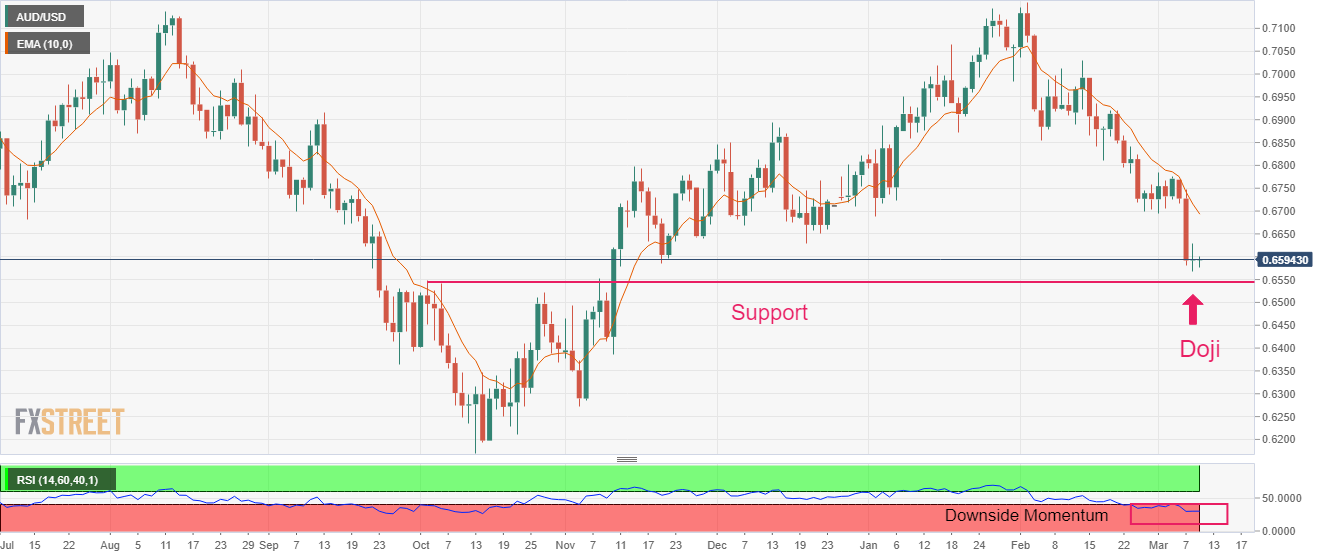
  • A Doji candlestick formation indicates indecisiveness among market participants.
  • An oscillation in the 20.00-40.00 range by the RSI (14) indicates that the bearish momentum is currently active.

The AUD/USD pair is displaying a subdued performance below 0.6600 in the Asian session. The upside in the Aussie asset seems restricted as Reserve Bank of Australia (RBA) Governor Philip Lowe has considered a pause in the rate-hiking spree and the Chinese economy is struggling to accelerate domestic demand despite significant reopening measures.

S&P500 futures have witnessed immense pressure as a sense of deflation conveyed by Chinese Consumer Price Index (CPI) and Producer Price Index (PPI) data indicates that the economy will take plenty of time to strengthen its economic outlook.

The US Dollar Index (DXY) is auctioning in a limited range above 105.20 as investors are awaiting the release of the United States Nonfarm Payrolls (NFP) data for fresh impetus.

AUD/USD has formed a Doji candlestick pattern, which indicates indecisiveness among the sentiment of market participants for further direction. Usually, a Doji formation indicates a reversal after an established trend. However, it requires more filters to confirm a reversal. Also, the negligence of Doji is considered as the continuation of the ongoing trend.

The Australian Dollar might continue to face selling pressure from the 10-period Exponential Moving Average (EMA) at around 0.6700.

An oscillation in the 20.00-40.00 range by the Relative Strength Index (RSI) (14) indicates that the bearish momentum is currently active. The momentum indicator is not shown any sign of divergence and a situation of oversold.

Going forward, a breakdown of Wednesday’s low at 0.6568 will drag the asst toward the horizontal support plotted from October 4 high at 0.6547 followed by the round-level support at 0.6500.

In an alternate scenario, a break above Doji’s high at 0.6629 will push the Aussie asset toward December 22 low at 0.6650. A break above the same might expose the major to February 27 low near 0.6700.

AUD/USD daily chart

AUD/USD

Overview
Today last price 0.6596
Today Daily Change 0.0002
Today Daily Change % 0.03
Today daily open 0.6594
 
Trends
Daily SMA20 0.6811
Daily SMA50 0.6893
Daily SMA100 0.676
Daily SMA200 0.6784
 
Levels
Previous Daily High 0.6629
Previous Daily Low 0.6568
Previous Weekly High 0.6784
Previous Weekly Low 0.6695
Previous Monthly High 0.7158
Previous Monthly Low 0.6698
Daily Fibonacci 38.2% 0.6606
Daily Fibonacci 61.8% 0.6591
Daily Pivot Point S1 0.6565
Daily Pivot Point S2 0.6536
Daily Pivot Point S3 0.6504
Daily Pivot Point R1 0.6626
Daily Pivot Point R2 0.6658
Daily Pivot Point R3 0.6687


Share: Feed news

Information on these pages contains forward-looking statements that involve risks and uncertainties. Markets and instruments profiled on this page are for informational purposes only and should not in any way come across as a recommendation to buy or sell in these assets. You should do your own thorough research before making any investment decisions. FXStreet does not in any way guarantee that this information is free from mistakes, errors, or material misstatements. It also does not guarantee that this information is of a timely nature. Investing in Open Markets involves a great deal of risk, including the loss of all or a portion of your investment, as well as emotional distress. All risks, losses and costs associated with investing, including total loss of principal, are your responsibility. The views and opinions expressed in this article are those of the authors and do not necessarily reflect the official policy or position of FXStreet nor its advertisers. The author will not be held responsible for information that is found at the end of links posted on this page.

If not otherwise explicitly mentioned in the body of the article, at the time of writing, the author has no position in any stock mentioned in this article and no business relationship with any company mentioned. The author has not received compensation for writing this article, other than from FXStreet.

FXStreet and the author do not provide personalized recommendations. The author makes no representations as to the accuracy, completeness, or suitability of this information. FXStreet and the author will not be liable for any errors, omissions or any losses, injuries or damages arising from this information and its display or use. Errors and omissions excepted.

The author and FXStreet are not registered investment advisors and nothing in this article is intended to be investment advice.

Follow us on Telegram

Stay updated of all the news

Join Telegram

Recommended content


Follow us on Telegram

Stay updated of all the news

Join Telegram

Recommended content

Editors’ Picks

EUR/USD closes in on 1.0700 amid broad USD strength

EUR/USD closes in on 1.0700 amid broad USD strength

EUR/USD came under renewed bearish pressure in the American session and dropped to its lowest level since late March near 1.0700. Stronger-than-forecast PCE inflation data and hawkish comments from Fed's Mester provide a boost to the US Dollar and weigh on the pair.

EUR/USD News

GBP/USD loses bullish momentum after US data, falls below 1.2350

GBP/USD loses bullish momentum after US data, falls below 1.2350

GBP/USD has reversed its direction and erased a large portion of its daily gains on Friday after the data from the US showed that the annual core PCE inflation edged higher to 4.7% in April. Although the pair clings to small daily gains below 1.2350, it remains on track to end the third straight week in negative territory.

GBP/USD News

Gold erases daily gains, holds above $1,940

Gold erases daily gains, holds above $1,940

Gold price turned south and declined to the $1,940 area in the American session on Friday. The benchmark 10-year US Treasury bond yield holds stead above 3.8% after stronger-than-expected core PCE inflation data from the US, not allowing XAU/USD to gain traction.

Gold News

Ethereum price to outpace Bitcoin price as ETH jumps over key hurdle where BTC fumbles

Ethereum price to outpace Bitcoin price as ETH jumps over key hurdle where BTC fumbles

ETH is working on its recovery after it dipped to a two-week low on Thursday. While Bitcoin price has failed to make a similar move and head back above $26,500, Ethereum is outpacing Bitcoin and has been able to push above $1,800.

Read more

Ford Stock: New agreement will give customers access to 12,000 Tesla chargers

Ford Stock: New agreement will give customers access to 12,000 Tesla chargers

Ford (F) stock has advanced about 2.5% early Friday following CEO Chris Farley’s announcement that Ford owners will be able to charge their EVs at Tesla Superchargers beginning in early 2024.

Read more

Forex MAJORS

Cryptocurrencies

Signatures