AUD/NZD Price Analysis: Bears seeking a discount from bearish structure for break of support
- AUD/NZD is now setting up for a number of outcomes.
- Bears are in control in general until the daily M-formation's neckline is breached and price heads higher.

As per the series of prior analysis, AUD/NZD Price Analysis: Bears holding their ground, eyes on downside continuation, and, AUD/NZD Price Analysis: Bears moving into 4th-gear, the bearish price action has gone according to the market structure in a series of bearish impulses.
At the time of writing, the price is correcting three consecutive days of bearish closes at a demand area which is a common feature on the charts and is to be expected.
There are prospects of a higher correction still prior to the next decisive move to the downside and the following illustrates the thesis:
Prior analysis
''We have now seen the price break prior support as follows, which stands the bears in good stead for the opening sessions this week:''
''There could be a restest of the old support that would be expected to act now as resistance.
From a 4-hour perspective, the M-formation could be anticipated to pull in a bid to test the neckline resistance and 21-EMA confluence as follows:''
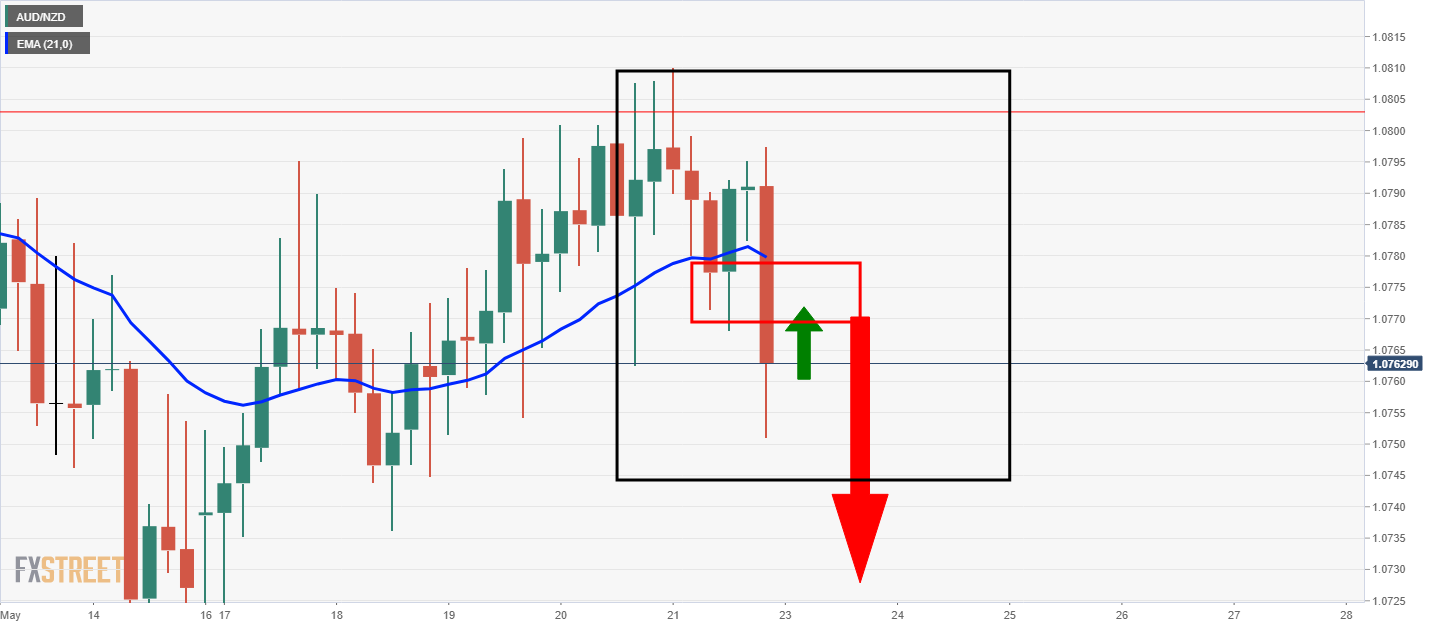
''The price retested the old support as illustrated in the above chart before moving a touch lower.''
''The price is now below new daily bearish structure which includes the confluence of the 21-EMA and the 38.2% Fibonacci retracement of the bearish impulse.
From a 4-hour perspective, this gives a vantage point from where to assess the bearish environment for additional conviction as follows:''
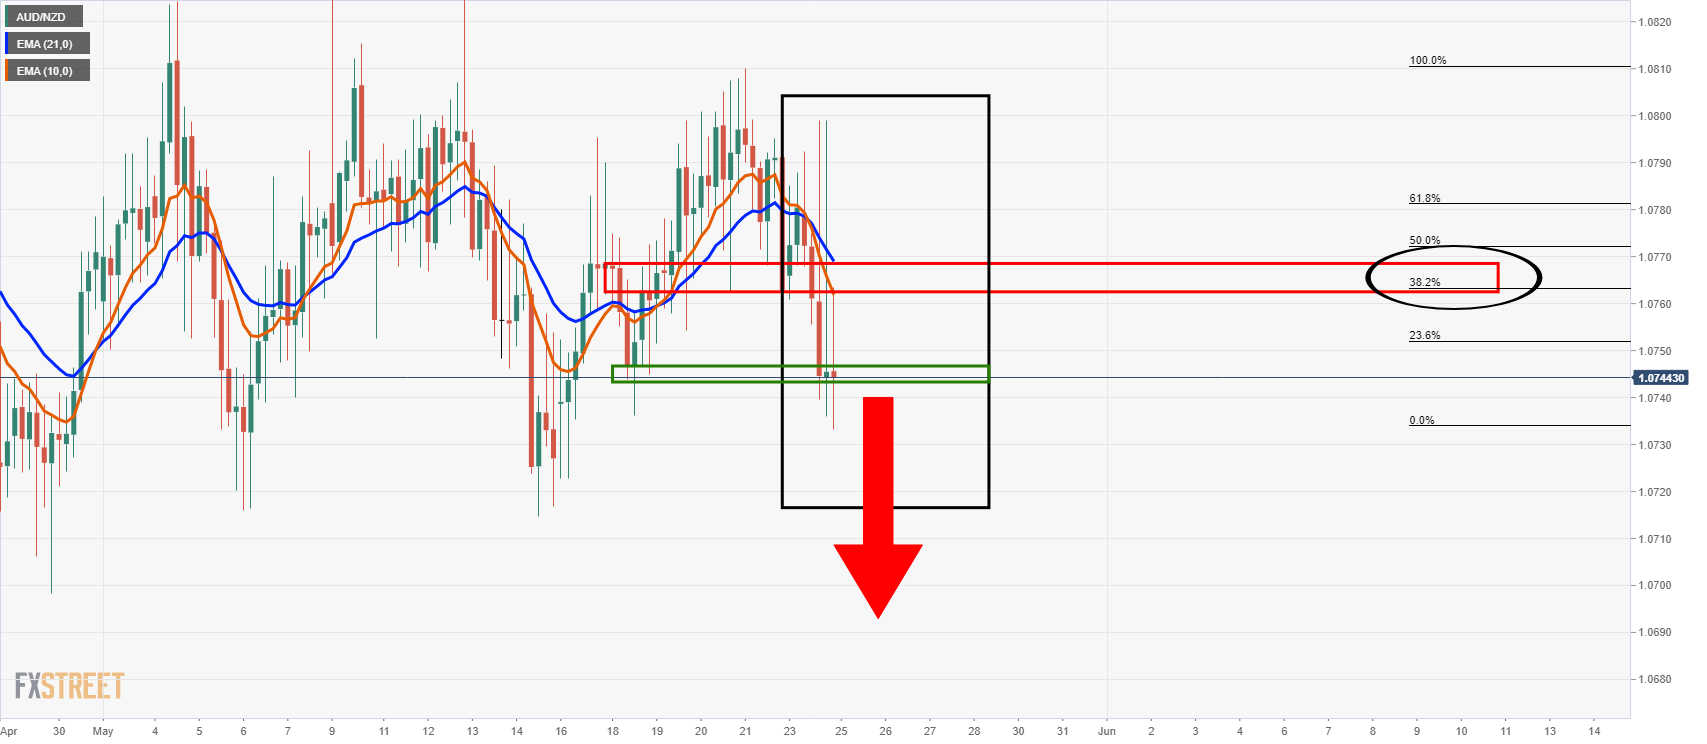
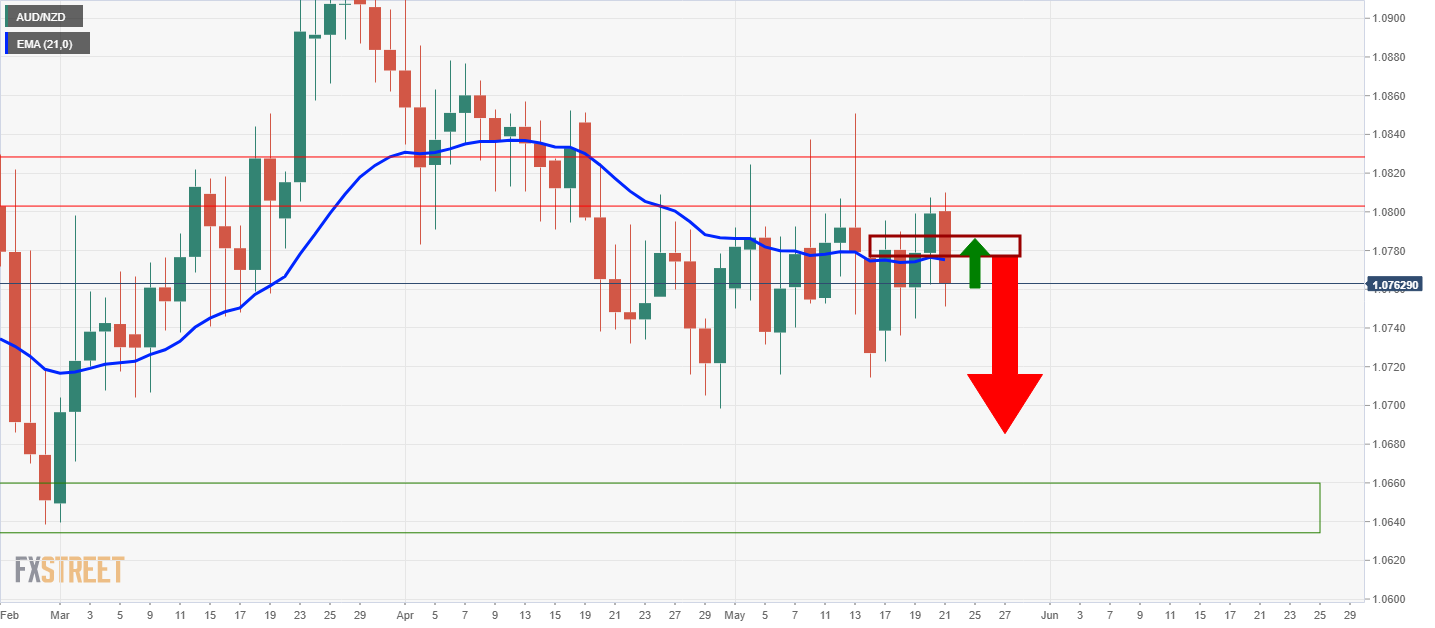
''The bears are being held up at meanwhile support but the price trades below the bearish 21 and 10 EMA crossover and daily resistance.
A break below support will add more conviction to the bearish bias.''
Live market analysis
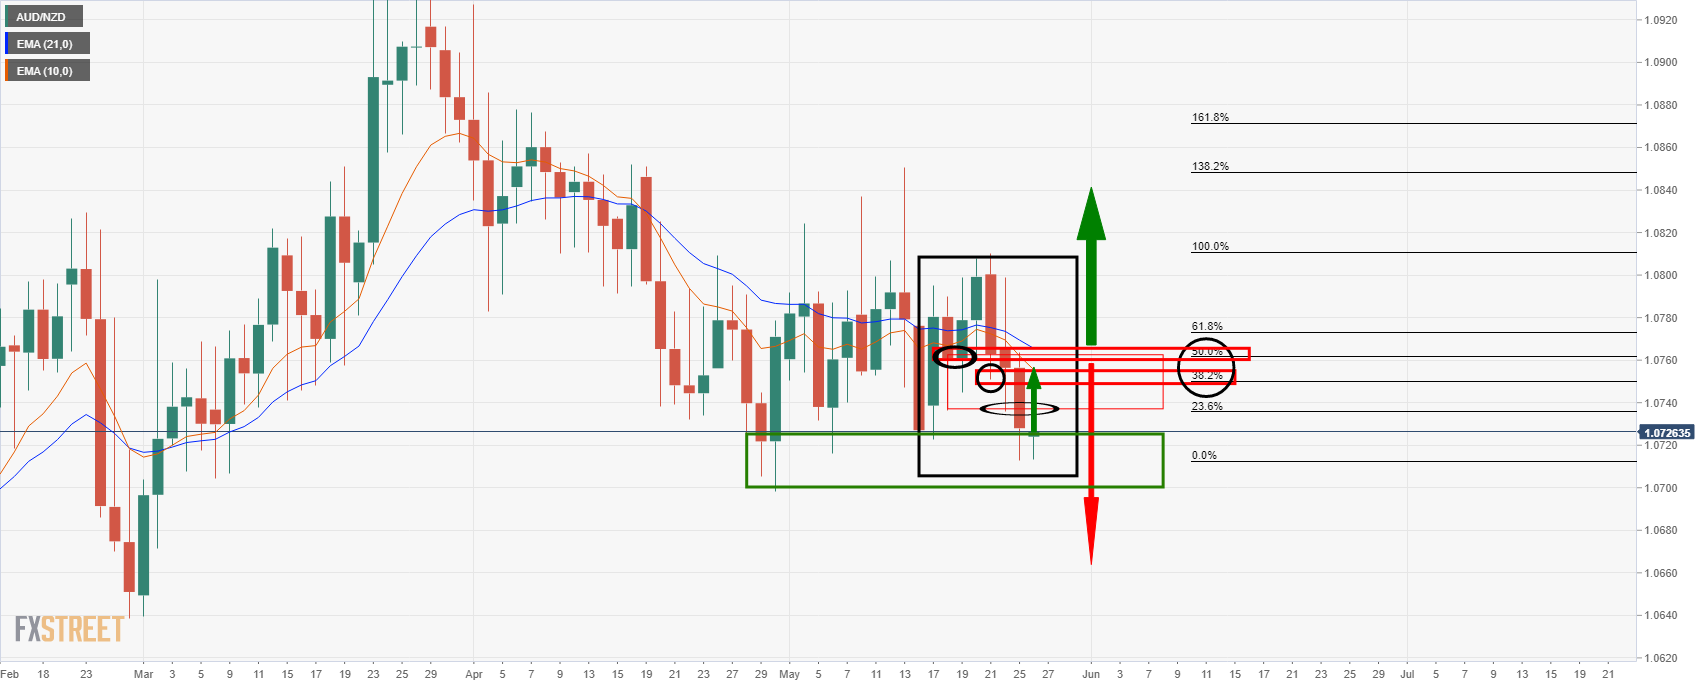
In the above jumble of technical analysis, the simplified approach to it is to note that, a) the price is meeting a demand area and correcting the latest bearish impulse which is to be expected, b) and there are three bearish scenarios, one bullish or a trapped market between familiar resistance supporting ranges.
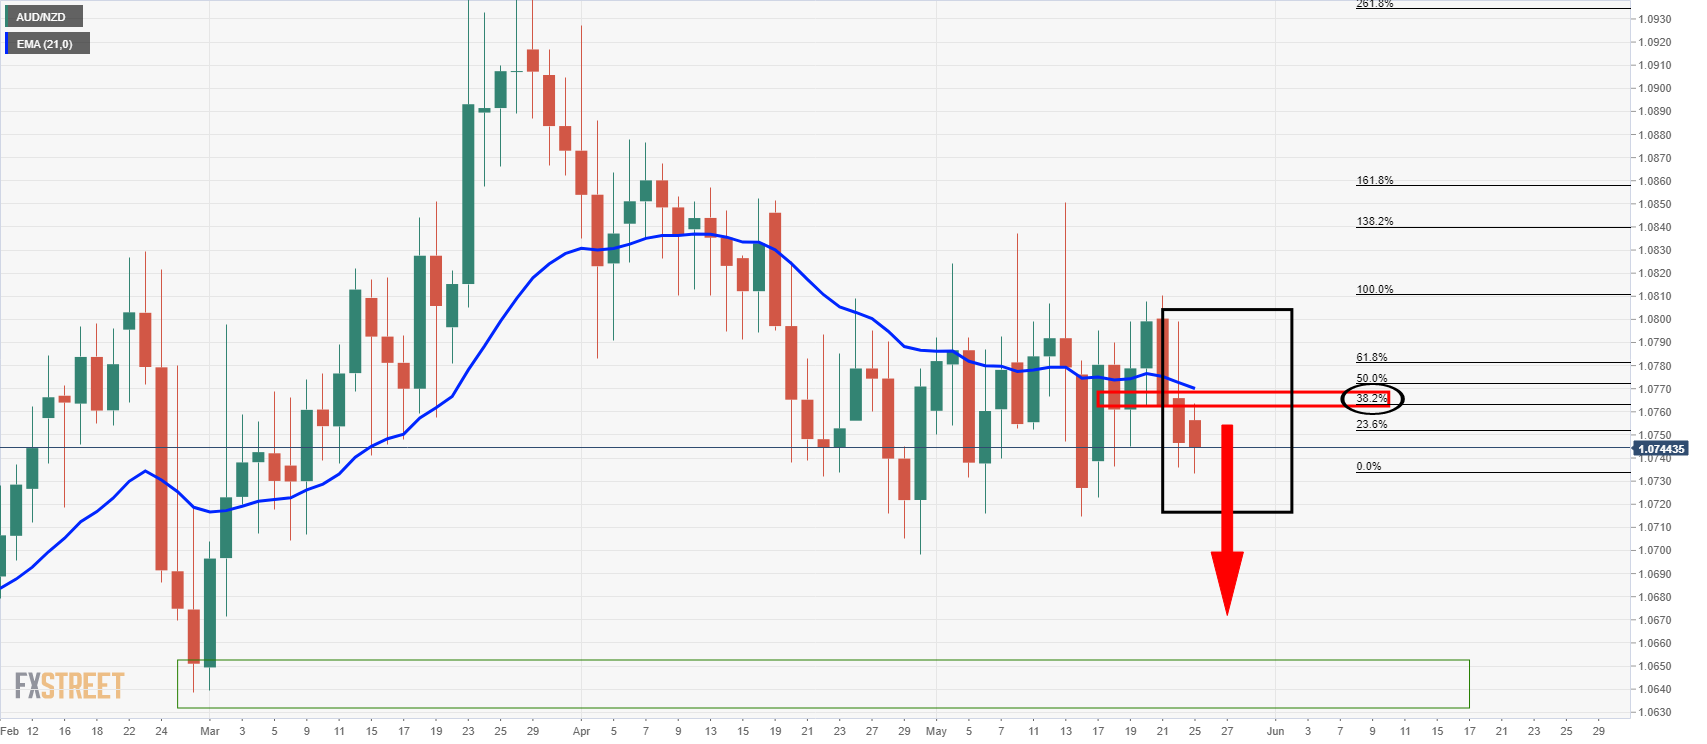
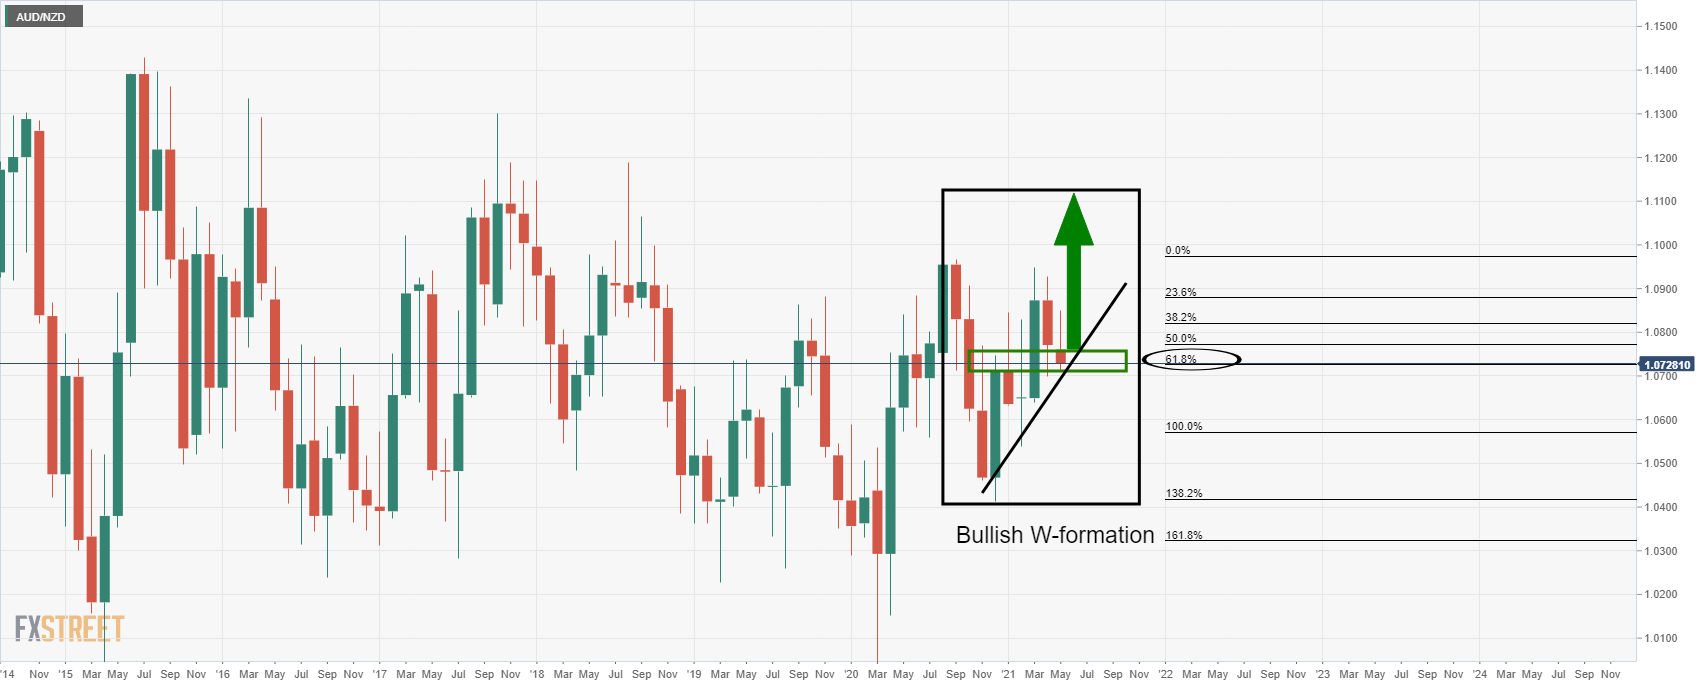
Scenario 1 bullish) The price breaks the resistance of Fibonaccis, prior lows and the 10 and 20 EMAs and moves higher, in accordance with the monthly chart's bullish outlook:
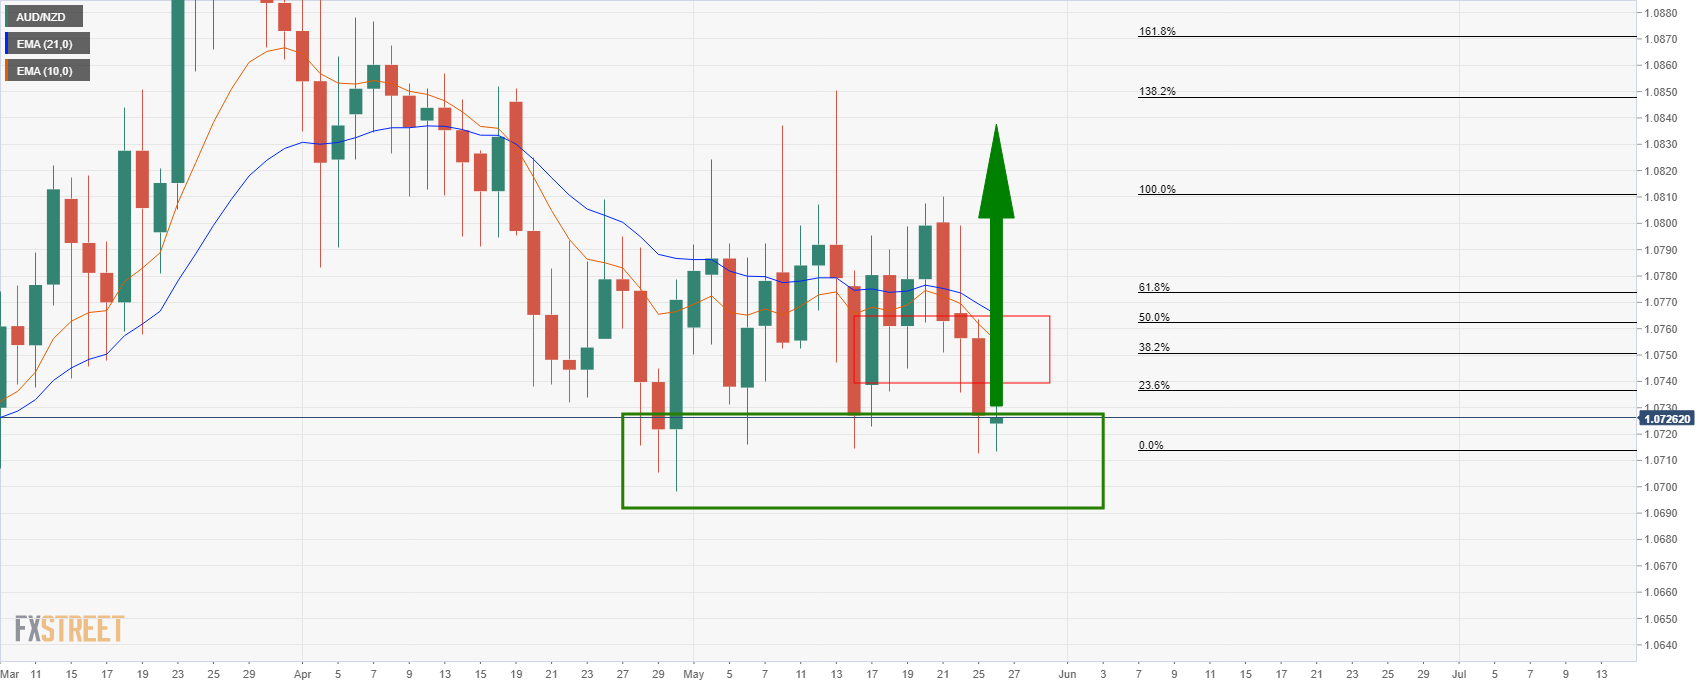
Monthly chart, bullish scenario 1 extended:
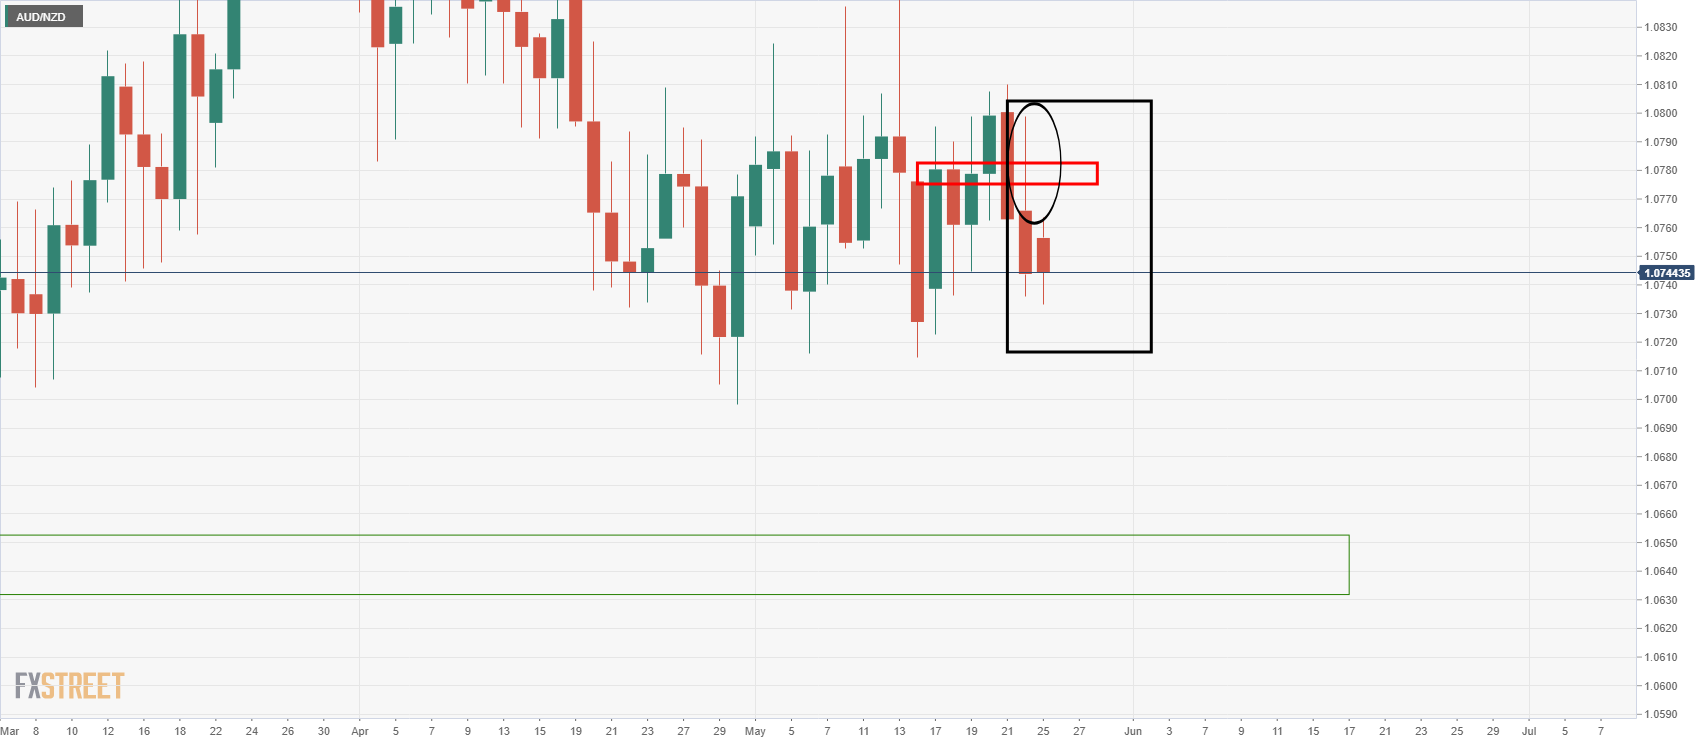
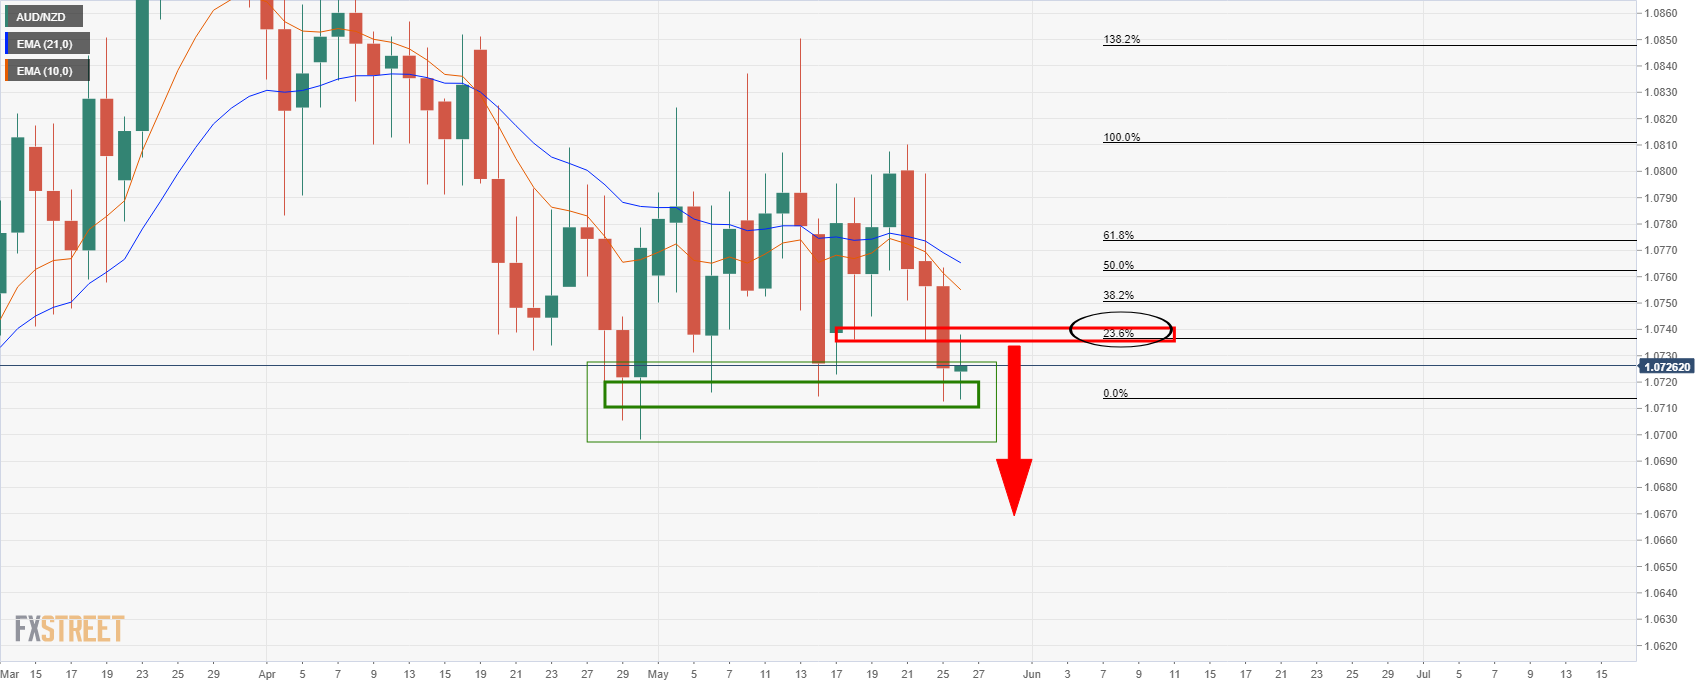
Scenario 2, bearish) The price that has tested the prior spike lows in a 23.6% Fino retracement just melts from here:
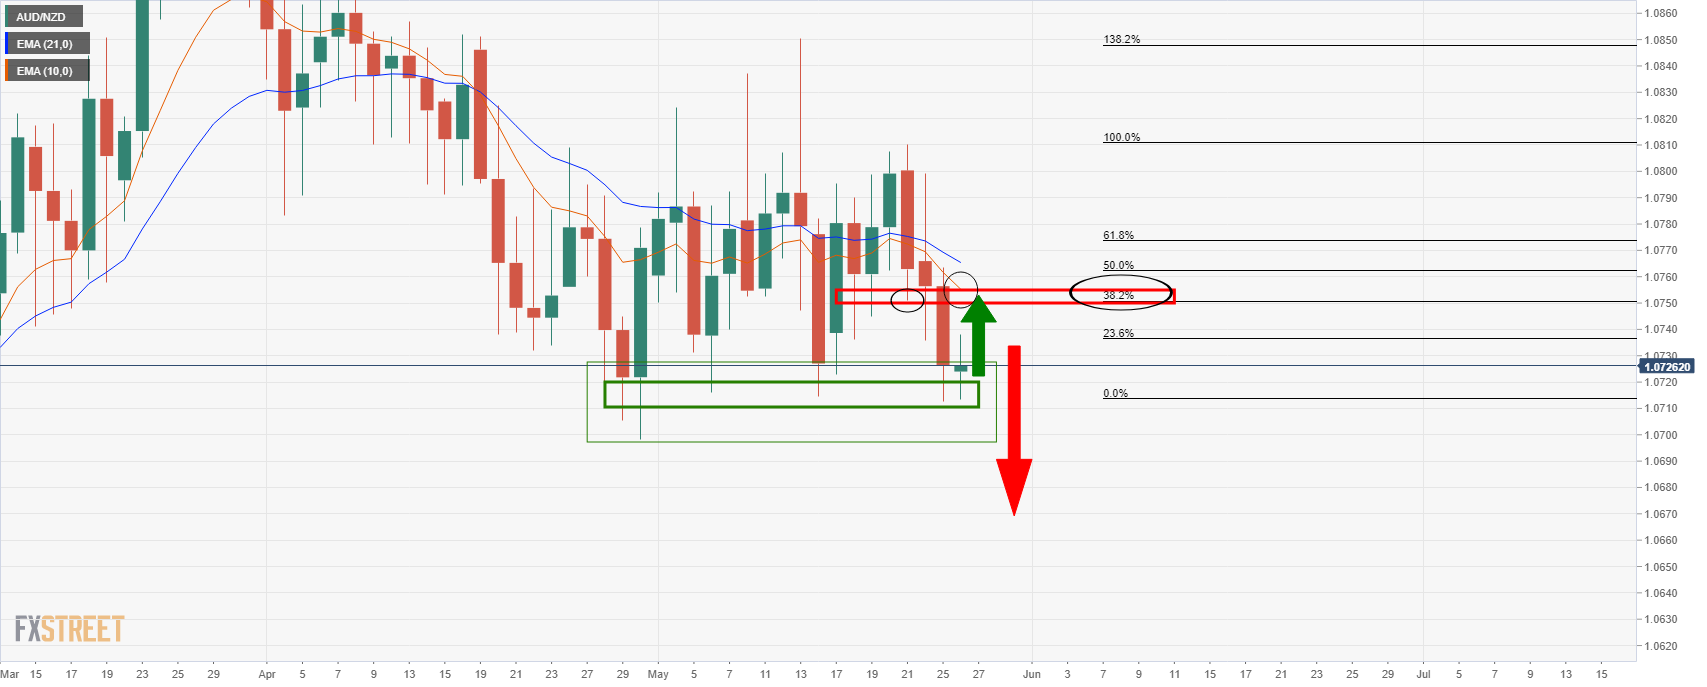
Scenario 3, bearish) The price moves in on the 38.2% Fibo and confluence with prior lows and the 10-day EMA and then melts:
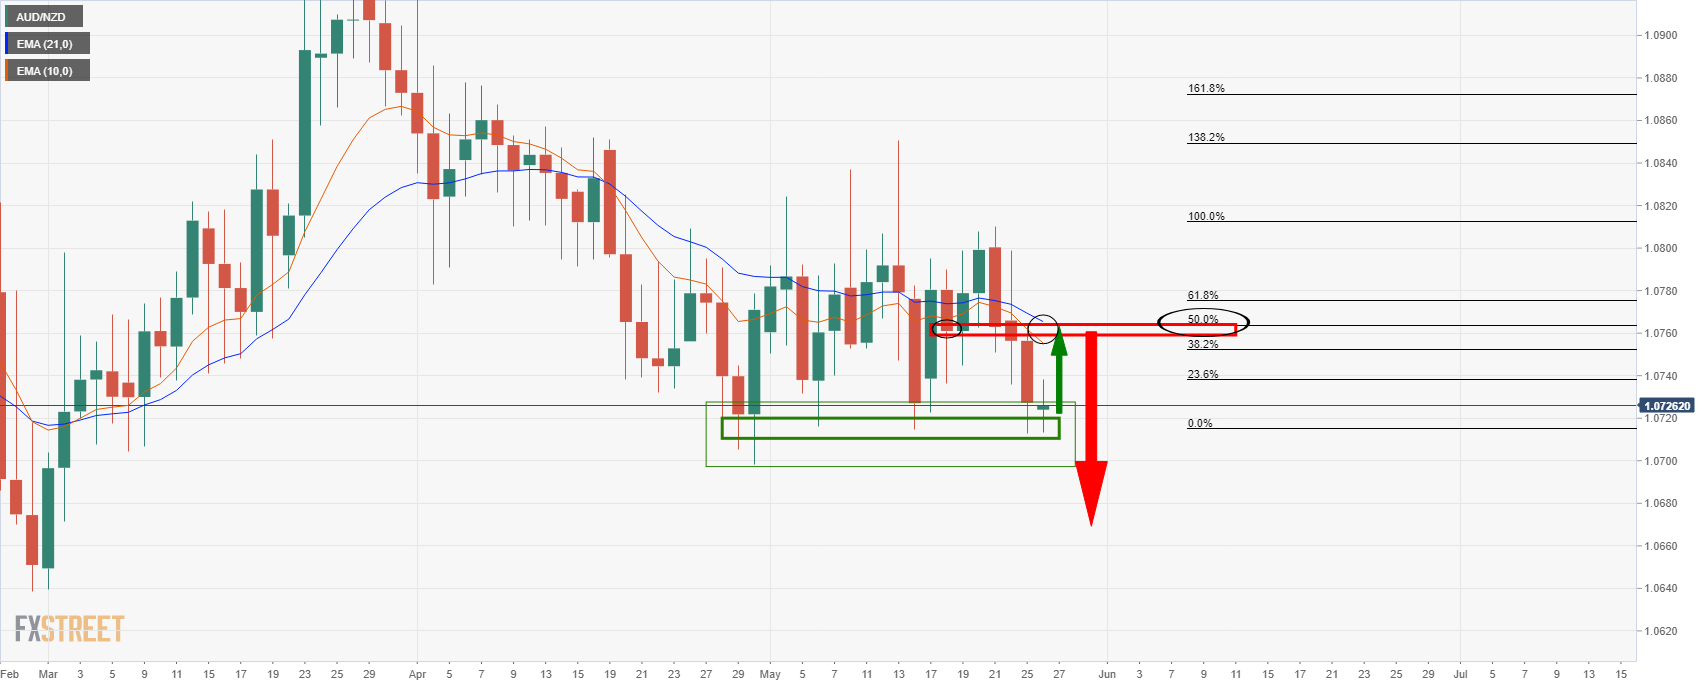
Scenario 4, bearish) In a 50% mean reversion, the price moves in on the neckline of the formation at the close and open of the candles and tests deeper into resistance and the 10 and 20 EMAs and then melts to the downside:
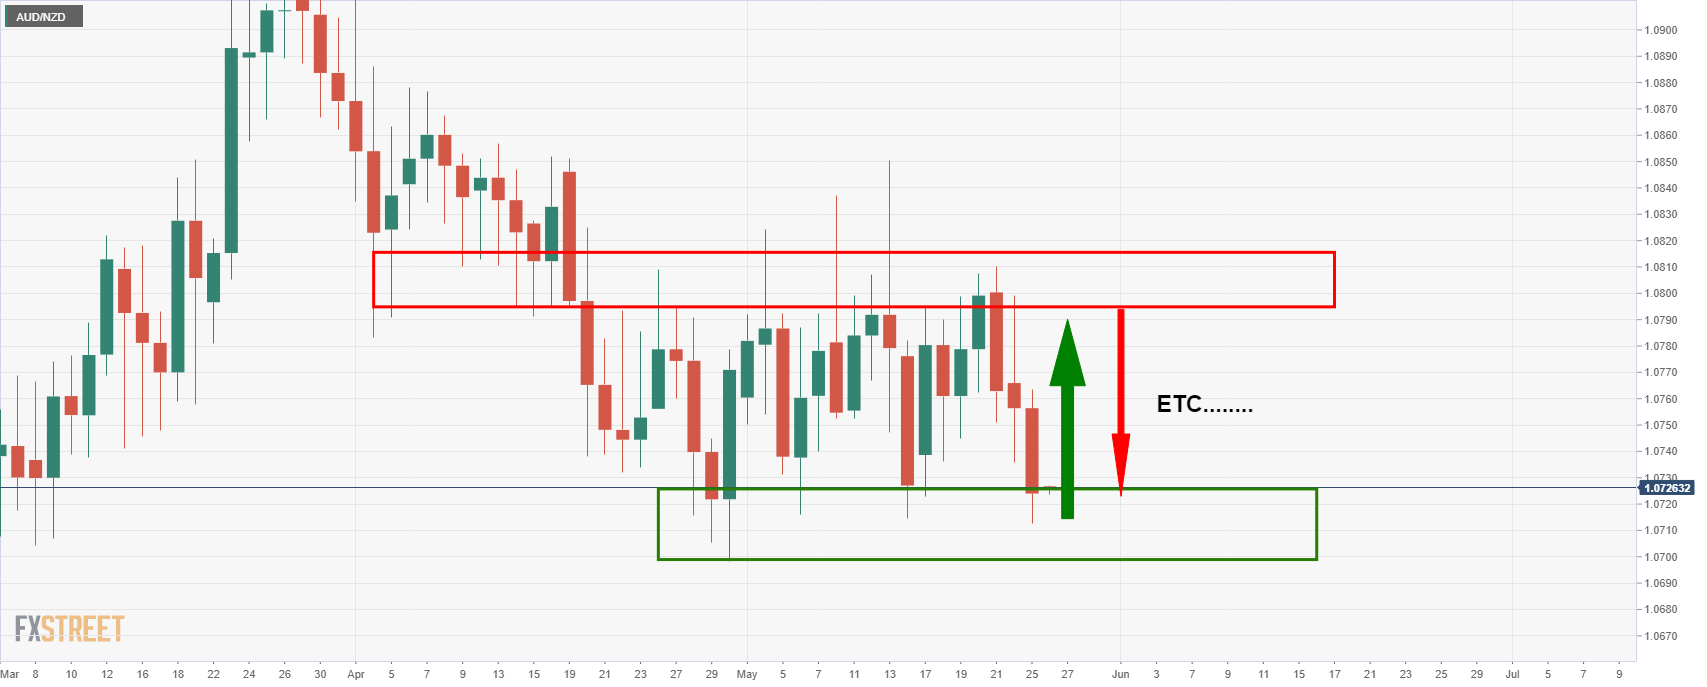
Failing a breakout one way or the other, the market will be trapped between resistance and support for days, weeks or come:
Author

Ross J Burland
FXStreet
Ross J Burland, born in England, UK, is a sportsman at heart. He played Rugby and Judo for his county, Kent and the South East of England Rugby team.


