AUD/NZD Price Analysis: Aussie Retail Sales direct bulls towards 1.0960 key hurdle


  • AUD/NZD picks up bids to extend week-start rebound from monthly low.
  • Australia Retail Sales rose past market forecasts and prior readings to print 1.9% growth in January.
  • Convergence of 100-EMA, previous support line from late December 2022 challenge buyers.
  • Upbeat oscillators, firmer Aussie data suggest further upside.

AUD/NZD bulls keep the reins around the mid-1.0900s while stretching the week-start recovery moves following the strong Australia Retail Sales data on early Tuesday. In doing so, the cross-currency pair approaches the short-term key resistance confluence.

That said, Australia’s seasonally adjusted Retail Sales rose 1.9% MoM versus 1.5% market forecasts and -3.9% previous readings, which in turn allowed the Aussie pair to refresh the intraday high near 0.6750.

Not only the upbeat Aussie data but the quote’s rebound from the 38.2% Fibonacci retracement level of the pair’s run-up between late 2022 and early February 2023, as well as the bullish MACD signals and upbeat RSI (14), also keep the AUD/NZD buyers hopeful.

However, a convergence of the 100-bar Exponential Moving Average (EMA) and the previous resistance line from late December 2022, around 1.0960, appears the key hurdle for the AUD/NZD bulls to cross to convince the buyers.

Following that, a run-up towards the 1.1000 psychological magnet and then to the monthly high surrounding 1.1090 can’t be ruled out.

Alternatively, the stated 38.2% Fibonacci retracement level puts a floor under the AUD/NZD prices of around 1.0900.

Following that, a seven-week-old horizontal support zone near 1.0880 will be crucial for the pair traders to watch as a break of which could convince sellers to retake control.

AUD/NZD: Four-hour chart

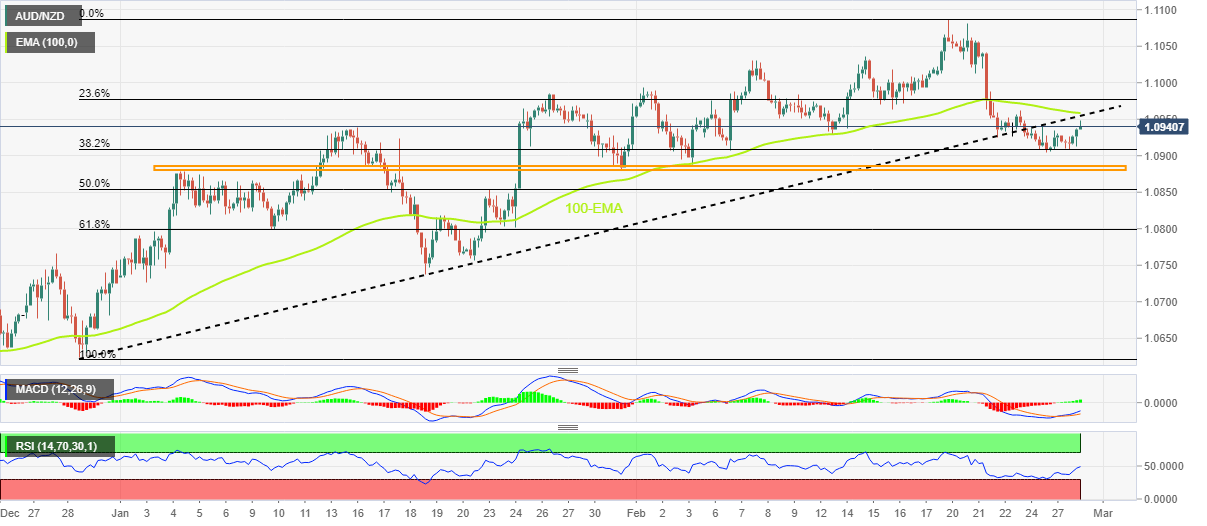
Trend: Further upside expected

Additional important levels

Overview
Today last price 1.0942
Today Daily Change 0.0015
Today Daily Change % 0.14%
Today daily open 1.0927
 
Trends
Daily SMA20 1.0971
Daily SMA50 1.0868
Daily SMA100 1.0871
Daily SMA200 1.1001
 
Levels
Previous Daily High 1.0934
Previous Daily Low 1.0908
Previous Weekly High 1.1087
Previous Weekly Low 1.0904
Previous Monthly High 1.0986
Previous Monthly Low 1.0726
Daily Fibonacci 38.2% 1.0924
Daily Fibonacci 61.8% 1.0918
Daily Pivot Point S1 1.0912
Daily Pivot Point S2 1.0897
Daily Pivot Point S3 1.0886
Daily Pivot Point R1 1.0938
Daily Pivot Point R2 1.0949
Daily Pivot Point R3 1.0964


Share: Feed news

Information on these pages contains forward-looking statements that involve risks and uncertainties. Markets and instruments profiled on this page are for informational purposes only and should not in any way come across as a recommendation to buy or sell in these assets. You should do your own thorough research before making any investment decisions. FXStreet does not in any way guarantee that this information is free from mistakes, errors, or material misstatements. It also does not guarantee that this information is of a timely nature. Investing in Open Markets involves a great deal of risk, including the loss of all or a portion of your investment, as well as emotional distress. All risks, losses and costs associated with investing, including total loss of principal, are your responsibility. The views and opinions expressed in this article are those of the authors and do not necessarily reflect the official policy or position of FXStreet nor its advertisers. The author will not be held responsible for information that is found at the end of links posted on this page.

If not otherwise explicitly mentioned in the body of the article, at the time of writing, the author has no position in any stock mentioned in this article and no business relationship with any company mentioned. The author has not received compensation for writing this article, other than from FXStreet.

FXStreet and the author do not provide personalized recommendations. The author makes no representations as to the accuracy, completeness, or suitability of this information. FXStreet and the author will not be liable for any errors, omissions or any losses, injuries or damages arising from this information and its display or use. Errors and omissions excepted.

The author and FXStreet are not registered investment advisors and nothing in this article is intended to be investment advice.

Recommended content


Recommended content

Editors’ Picks

USD/JPY jumps above 156.00 on BoJ's steady policy

USD/JPY jumps above 156.00 on BoJ's steady policy

USD/JPY has come under intense buying pressure, surging past 156.00 after the Bank of Japan kept the key rate unchanged but tweaked its policy statement. The BoJ maintained its fiscal year 2024 and 2025 core inflation forecasts, disappointing the Japanese Yen buyers. 

USD/JPY News

AUD/USD consolidates gains above 0.6500 after Australian PPI data

AUD/USD consolidates gains above 0.6500 after Australian PPI data

AUD/USD is consolidating gains above 0.6500 in Asian trading on Friday. The pair capitalizes on an annual increase in Australian PPI data. Meanwhile, a softer US Dollar and improving market mood also underpin the Aussie ahead of the US PCE inflation data. 

AUD/USD News

Gold price flatlines as traders look to US PCE Price Index for some meaningful impetus

Gold price flatlines as traders look to US PCE Price Index for some meaningful impetus

Gold price lacks any firm intraday direction and is influenced by a combination of diverging forces. The weaker US GDP print and a rise in US inflation benefit the metal amid subdued USD demand. Hawkish Fed expectations cap the upside as traders await the release of the US PCE Price Index.

Gold News

Stripe looks to bring back crypto payments as stablecoin market cap hits all-time high

Stripe looks to bring back crypto payments as stablecoin market cap hits all-time high

Stripe announced on Thursday that it would add support for USDC stablecoin, as the stablecoin market exploded in March, according to reports by Cryptocompare.

Read more

US economy: Slower growth with stronger inflation

US economy: Slower growth with stronger inflation

The US Dollar strengthened, and stocks fell after statistical data from the US. The focus was on the preliminary estimate of GDP for the first quarter. Annualised quarterly growth came in at just 1.6%, down from the 2.5% and 3.4% previously forecast.

Read more

Forex MAJORS

Cryptocurrencies

Signatures