AUD/JPY Price Forecast: Tests 100.50, nine-day EMA amid potential momentum shift


  • AUD/JPY may appreciate as daily chart analysis indicates a potential shift in price momentum from bearish to bullish.
  • A bullish reversal could be possible if the nine-day EMA breaks above the 14-day EMA.
  • A break above nine- and 14-day EMAs could cause the emergence of a bullish bias.

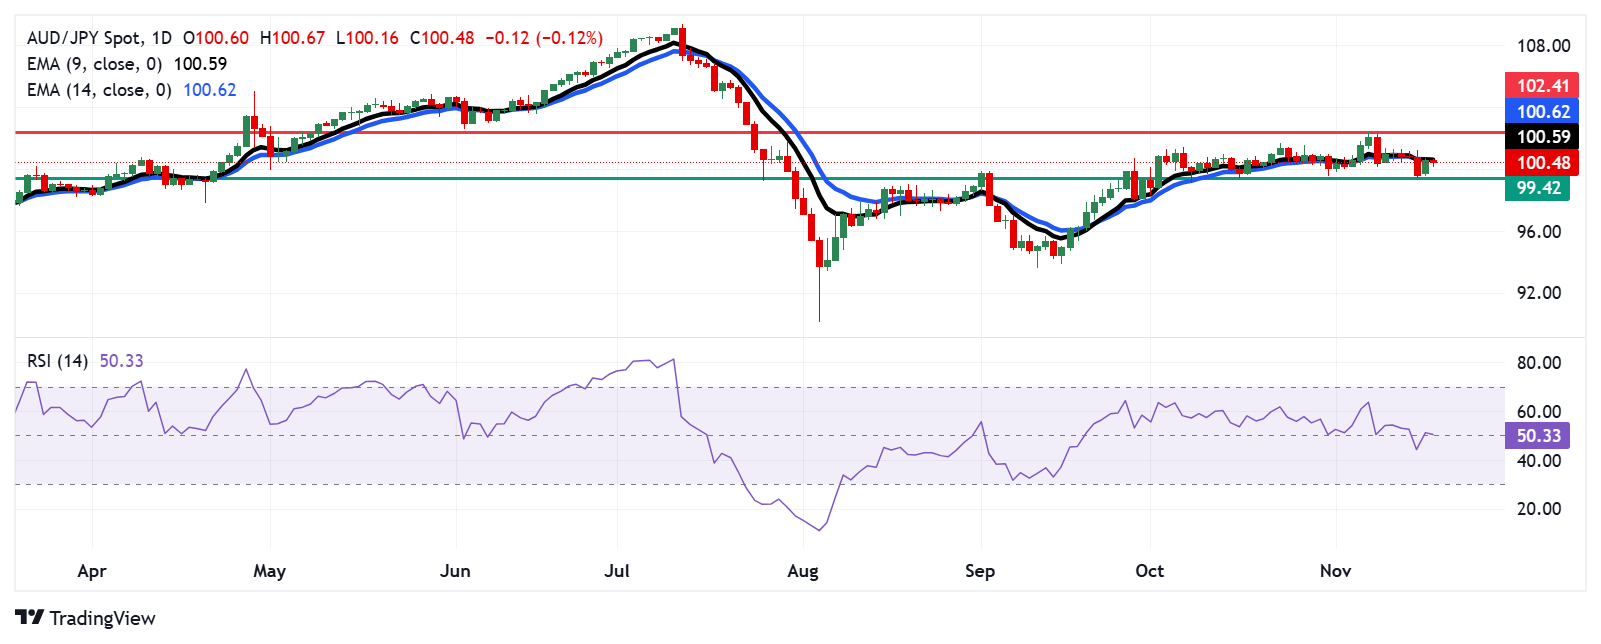
The AUD/JPY cross remains relatively flat around 100.50 during the Asian trading session on Tuesday, following a nearly 1% gain in the previous session. An analysis of the daily chart suggests a potential shift in momentum from bearish to bullish as the pair seeks to break above the nine-day Exponential Moving Average (EMA).

Additionally, the nine-day EMA is currently just below the 14-day EMA. An upward crossover would signal a shift in the short-term price momentum from bearish to bullish, as it indicates that recent prices are gaining strength and pushing higher compared to the longer-term trend.

Additionally, the 14-day Relative Strength Index (RSI) is at the 50 level, signaling a neutral market condition. Any further movement in the AUD/JPY cross will likely determine the next clear directional trend.

To the upside, the AUD/JPY cross is testing immediate resistance at the nine-day EMA around the 100.58 level, followed by the 100.61 level. A break above these levels could trigger a bullish bias, potentially pushing the currency cross toward the four-month high of 102.41, reached on November 7.

On the downside, the primary support for the AUD/JPY cross is located around the recent low of 99.42. A break below this level would strengthen the bearish outlook and could drive the cross toward the psychological support level of 99.00.

AUD/JPY: Daily Chart

Australian Dollar PRICE Today

The table below shows the percentage change of Australian Dollar (AUD) against listed major currencies today. Australian Dollar was the weakest against the Japanese Yen.

  USD EUR GBP JPY CAD AUD NZD CHF
USD   0.07% 0.05% -0.09% 0.06% 0.04% 0.12% 0.05%
EUR -0.07%   -0.02% -0.13% -0.01% -0.03% 0.06% -0.02%
GBP -0.05% 0.02%   -0.10% 0.01% -0.01% 0.08% 0.00%
JPY 0.09% 0.13% 0.10%   0.15% 0.12% 0.20% 0.14%
CAD -0.06% 0.00% -0.01% -0.15%   -0.02% 0.06% -0.02%
AUD -0.04% 0.03% 0.01% -0.12% 0.02%   0.09% 0.03%
NZD -0.12% -0.06% -0.08% -0.20% -0.06% -0.09%   -0.07%
CHF -0.05% 0.02% -0.01% -0.14% 0.02% -0.03% 0.07%  

The heat map shows percentage changes of major currencies against each other. The base currency is picked from the left column, while the quote currency is picked from the top row. For example, if you pick the Australian Dollar from the left column and move along the horizontal line to the US Dollar, the percentage change displayed in the box will represent AUD (base)/USD (quote).

Share: Feed news

Information on these pages contains forward-looking statements that involve risks and uncertainties. Markets and instruments profiled on this page are for informational purposes only and should not in any way come across as a recommendation to buy or sell in these assets. You should do your own thorough research before making any investment decisions. FXStreet does not in any way guarantee that this information is free from mistakes, errors, or material misstatements. It also does not guarantee that this information is of a timely nature. Investing in Open Markets involves a great deal of risk, including the loss of all or a portion of your investment, as well as emotional distress. All risks, losses and costs associated with investing, including total loss of principal, are your responsibility. The views and opinions expressed in this article are those of the authors and do not necessarily reflect the official policy or position of FXStreet nor its advertisers. The author will not be held responsible for information that is found at the end of links posted on this page.

If not otherwise explicitly mentioned in the body of the article, at the time of writing, the author has no position in any stock mentioned in this article and no business relationship with any company mentioned. The author has not received compensation for writing this article, other than from FXStreet.

FXStreet and the author do not provide personalized recommendations. The author makes no representations as to the accuracy, completeness, or suitability of this information. FXStreet and the author will not be liable for any errors, omissions or any losses, injuries or damages arising from this information and its display or use. Errors and omissions excepted.

The author and FXStreet are not registered investment advisors and nothing in this article is intended to be investment advice.

XM
Account
7.2
Tools
9.2
Service
9.4
Trading
9.0
Trust
7.0
Experience
8.4
Read review
Moneta Markets
Account
7.4
Tools
6.6
Service
8.0
Trading
6.6
Trust
5.2
Experience
9.2
Read review
Trading Pro
Account
7.2
Tools
5.2
Service
6.6
Trading
8.0
Trust
5.0
Experience
7.0
Read review
Pepperstone
Account
8.2
Tools
8.2
Service
7.4
Trading
9.0
Trust
8.8
Experience
9.0
Read review
XM
Read review
Moneta Markets
Read review
Trading Pro
Read review
Pepperstone
Read review
Trading Pro
Read review
Pepperstone
Read review
XM
Read review
Moneta Markets
Read review
Trading Pro
Account
7.2
Tools
5.2
Service
6.6
Trading
8.0
Trust
5.0
Experience
7.0
Read review
Pepperstone
Account
8.2
Tools
8.2
Service
7.4
Trading
9.0
Trust
8.8
Experience
9.0
Read review
XM
Account
7.2
Tools
9.2
Service
9.4
Trading
9.0
Trust
7.0
Experience
8.4
Read review
Moneta Markets
Account
7.4
Tools
6.6
Service
8.0
Trading
6.6
Trust
5.2
Experience
9.2
Read review

Recommended content


Recommended content

Editors’ Picks

EUR/USD clings to recovery gains near 1.0950 on US Dollar weakness

EUR/USD clings to recovery gains near 1.0950 on US Dollar weakness

EUR/USD is holding onto recovery gains near 1.0850 in European trading on Tuesday amid a broadly weaker US Dollar. The recovery in risk sentiment undermines the havem demand for the US Dollar, lifting the pair. Dovish Fed expectations also weigh negatively on the Greenback. Tariff updates eyed. 

EUR/USD News
GBP/USD pares back gains toward 1.2750

GBP/USD pares back gains toward 1.2750

GBP/USD is paring back gains to revisit 1.2750 in Tuesday's European session. The pair draws support from renewed US Dollar weakness and a positive shift in risk sentiment but US President Trump's tariff war and global growth concerns limit its upside. 

GBP/USD News
Gold bounces back above $3,000 as trade war tensions flair up

Gold bounces back above $3,000 as trade war tensions flair up

Gold price is bouncing higher in tandem with Equities after another stellar nosedive move on Monday. The precious metal trades just above the $3,000 mark at the time of writing on Tuesday. The bounce is supported by a technical element on the one hand and a geopolitical driver on the other.

Gold News
XRP battles tariff turbulence amid MVRV buy signal

XRP battles tariff turbulence amid MVRV buy signal

Ripple seeks stability in a volatile crypto landscape influenced by macroeconomic factors, including reciprocal tariffs. The international money transfer token hit a low of $1.64 on Monday after opening the week at $1.92, representing a 14.5% daily drop. 

Read more
Strategic implications of “Liberation Day”

Strategic implications of “Liberation Day”

Liberation Day in the United States came with extremely protectionist and inward-looking tariff policy aimed at just about all U.S. trading partners. In this report, we outline some of the more strategic implications of Liberation Day and developments we will be paying close attention to going forward.

Read more
The Best brokers to trade EUR/USD

The Best brokers to trade EUR/USD

SPONSORED Discover the top brokers for trading EUR/USD in 2025. Our list features brokers with competitive spreads, fast execution, and powerful platforms. Whether you're a beginner or an expert, find the right partner to navigate the dynamic Forex market.

Read More

Forex MAJORS

Cryptocurrencies

Signatures

Best Brokers of 2025