AUD/JPY Price Forecast: Recovers after intraday slump to sub-96.00 levels, bearish bias remains
- AUD/JPY attracts heavy selling following the release of softer domestic GDP growth figures.
- A slightly oversold RSI on the daily chart prompts intraday short covering around the cross.
- Bets for an early RBA rate cut and December BoJ rate-hike expectations should cap the upside.

The AUD/JPY cross dropped to its lowest level since September 18 during the Asian session on Wednesday as softer Australian GDP print lifted bets for an early interest rate cut by the Reserve Bank of Australia (RBA). Moreover, expectations that the Bank of Japan (BoJ) will hike interest rates again in December contribute to the Japanese Yen's (JPY) relative outperformance and exert additional pressure on the currency pair.
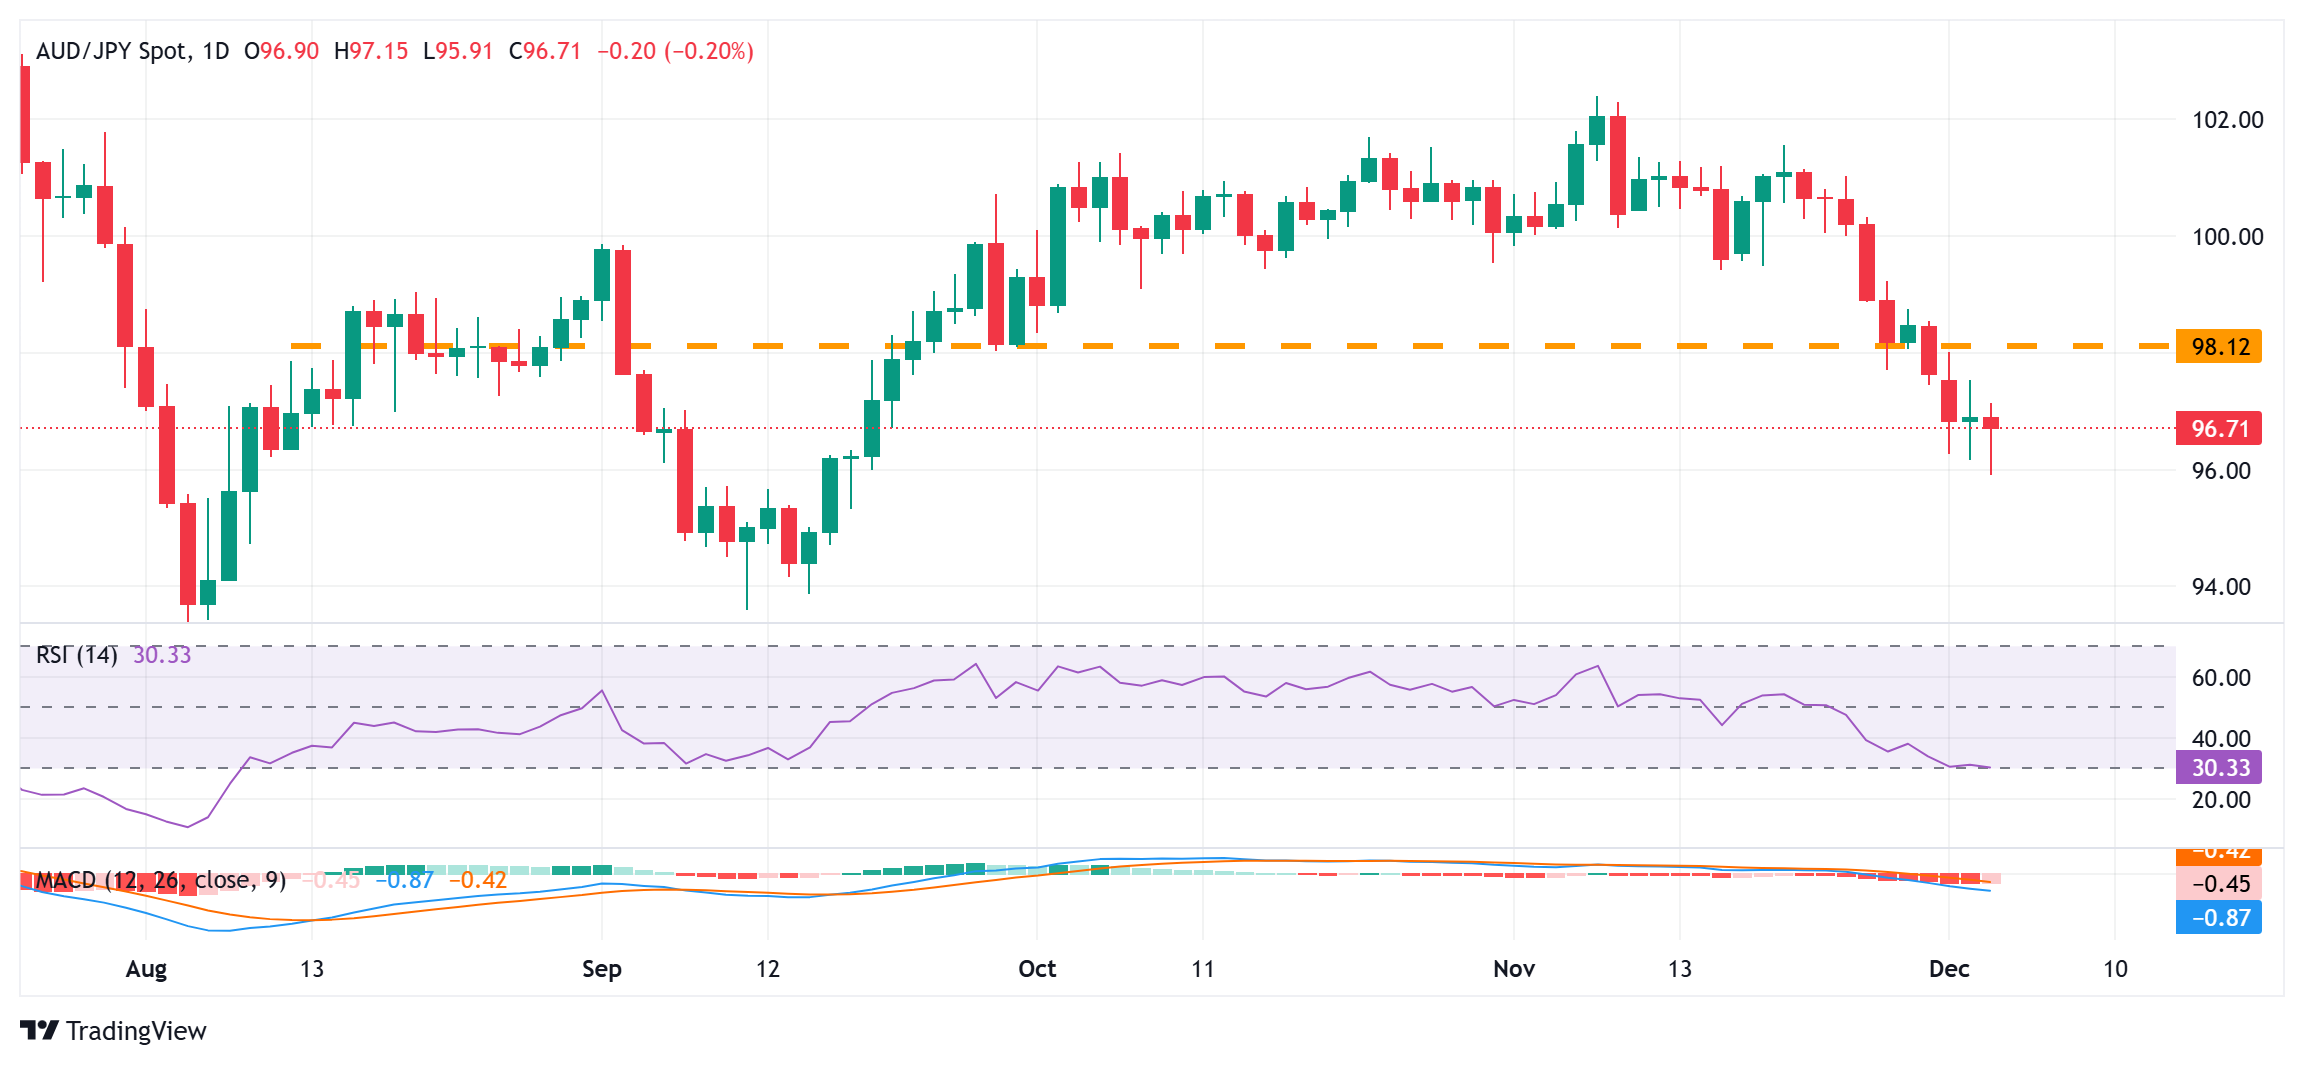
Spot prices, however, managed to rebound over 70 pips from sub-96.00 levels and currently trade around 96.70, down 0.20% for the day. The Relative Strength Index (RSI) on the daily chart is flashing slightly oversold conditions and turns out to be a key factor that prompts some short-covering around the AUD/JPY cross. That said, the technical setup warrants caution before positioning for any further gains.
Last week's breakdown below the 98.00 round figure was seen as a key trigger for bearish traders. Furthermore, oscillators on the daily chart are holding deep in negative territory. This, in turn, suggests that any subsequent move up could be seen as a selling opportunity ahead of the 97.00 mark and cap the AUD/JPY cross near the 97.50 horizontal barrier. The latter might now act as a key pivotal point for short-term traders.
On the flip side, the 96.00 round figure might continue to offer some support. A convincing break and acceptance below the said handle will reaffirm the negative outlook and pave the way for deeper losses. The AUD/JPY cross might then slide to the next relevant support near the 95.30 region en route to the 95.00 psychological mark. The downfall could eventually drag spot prices to the 94.45-94.40 horizontal support and the 94.00 mark.
AUD/JPY daily chart
Economic Indicator
Gross Domestic Product (YoY)
The Gross Domestic Product (GDP), released by the Australian Bureau of Statistics on a quarterly basis, is a measure of the total value of all goods and services produced in Australia during a given period. The GDP is considered as the main measure of Australian economic activity. The YoY reading compares economic activity in the reference quarter compared with the same quarter a year earlier. Generally, a rise in this indicator is bullish for the Australian Dollar (AUD), while a low reading is seen as bearish.
Read more.Last release: Wed Dec 04, 2024 00:30
Frequency: Quarterly
Actual: 0.8%
Consensus: 1.1%
Previous: 1%
Source: Australian Bureau of Statistics
The Australian Bureau of Statistics (ABS) releases the Gross Domestic Product (GDP) on a quarterly basis. It is published about 65 days after the quarter ends. The indicator is closely watched, as it paints an important picture for the economy. A strong labor market, rising wages and rising private capital expenditure data are critical for the country’s improved economic performance, which in turn impacts the Reserve Bank of Australia’s (RBA) monetary policy decision and the Australian dollar. Actual figures beating estimates is considered AUD bullish, as it could prompt the RBA to tighten its monetary policy.
Author

Haresh Menghani
FXStreet
Haresh Menghani is a detail-oriented professional with 10+ years of extensive experience in analysing the global financial markets.


