AUD/JPY Price Analysis: Grinds near 92.00 post-RBA Minutes, inverse H&S teases bulls ahead of BOJ


  • AUD/JPY grinds higher even as RBA Minutes fail to impress traders.
  • RBA Minutes stated that policymakers discussed all options, eyed further rate hikes.
  • Inverse Head-and-Shoulders pattern, impending bull cross on MACD lure buyers.
  • 200-SMA, weekly resistance line add to the upside filters.

AUD/JPY picks up bids to 91.90 as buyers attack a short-term key hurdle after the Reserve Bank of Australia's (RBA) latest Monetary Policy Meeting Minutes during early Tuesday.

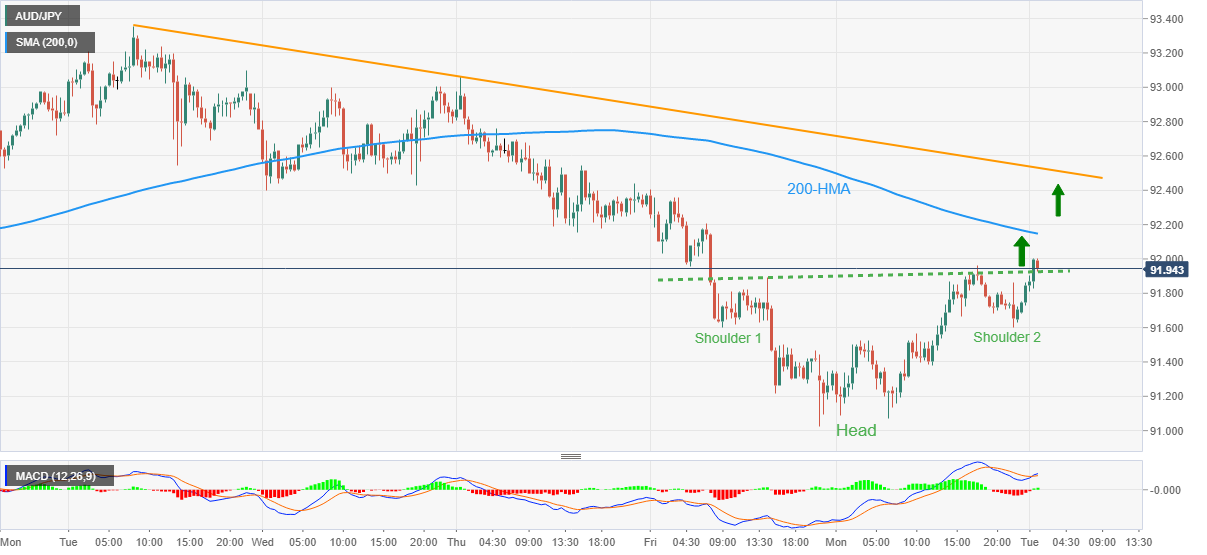
Even so, the cautious mood ahead of the Bank of Japan’s (BOJ) monetary policy meeting tests the cross-currency pair traders as it portrays the Inverse Head and Shoulders bullish chart pattern amid the looming bull cross on the MACD.

That said, the quote’s further upside aims for the 200-SMA level surrounding 92.15 before a one-week-old resistance line, close to 92.55 by the press time, could challenge the AUD/JPY buyers.

It’s worth noting that the inverse H&S formation suggests the theoretical target of 92.80 but an upside break of the 92.55 resistance line, mentioned above, won’t hesitate to challenge the previous weekly top of 93.35. In doing so, the quote may take a halt near the 93.00 round figure.

On the contrary, a downside break of the stated bullish formation’s neckline, currently around 91.90, could drag the quote back towards the monthly low marked the previous day near the 91.00 round figure.

However, lows marked in October and August, respectively near 90.85 and 90.55, could challenge the AUD/JPY bears afterward.

AUD/JPY: 30-minute chart

Trend: Further upside expected

Additional important levels

Overview
Today last price 92
Today Daily Change 0.26
Today Daily Change % 0.28%
Today daily open 91.74
 
Trends
Daily SMA20 92.62
Daily SMA50 93.39
Daily SMA100 94.04
Daily SMA200 93.29
 
Levels
Previous Daily High 91.96
Previous Daily Low 91.03
Previous Weekly High 93.36
Previous Weekly Low 91.22
Previous Monthly High 95.56
Previous Monthly Low 92.15
Daily Fibonacci 38.2% 91.6
Daily Fibonacci 61.8% 91.38
Daily Pivot Point S1 91.19
Daily Pivot Point S2 90.64
Daily Pivot Point S3 90.26
Daily Pivot Point R1 92.12
Daily Pivot Point R2 92.51
Daily Pivot Point R3 93.06


Share: Feed news

Information on these pages contains forward-looking statements that involve risks and uncertainties. Markets and instruments profiled on this page are for informational purposes only and should not in any way come across as a recommendation to buy or sell in these assets. You should do your own thorough research before making any investment decisions. FXStreet does not in any way guarantee that this information is free from mistakes, errors, or material misstatements. It also does not guarantee that this information is of a timely nature. Investing in Open Markets involves a great deal of risk, including the loss of all or a portion of your investment, as well as emotional distress. All risks, losses and costs associated with investing, including total loss of principal, are your responsibility. The views and opinions expressed in this article are those of the authors and do not necessarily reflect the official policy or position of FXStreet nor its advertisers. The author will not be held responsible for information that is found at the end of links posted on this page.

If not otherwise explicitly mentioned in the body of the article, at the time of writing, the author has no position in any stock mentioned in this article and no business relationship with any company mentioned. The author has not received compensation for writing this article, other than from FXStreet.

FXStreet and the author do not provide personalized recommendations. The author makes no representations as to the accuracy, completeness, or suitability of this information. FXStreet and the author will not be liable for any errors, omissions or any losses, injuries or damages arising from this information and its display or use. Errors and omissions excepted.

The author and FXStreet are not registered investment advisors and nothing in this article is intended to be investment advice.

Recommended content


Recommended content

Editors’ Picks

EUR/USD extends gains above 1.0700, focus on key US data

EUR/USD extends gains above 1.0700, focus on key US data

EUR/USD meets fresh demand and rises toward  1.0750 in the European session on Thursday. Renewed US Dollar weakness offsets the risk-off market environment, supporting the pair ahead of the key US GDP and PCE inflation data. 

EUR/USD News

GBP/USD extends recovery above 1.2500, awaits US GDP data

GBP/USD extends recovery above 1.2500, awaits US GDP data

GBP/USD is catching a fresh bid wave, rising above 1.2500 in European trading on Thursday. The US Dollar resumes its corrective downside, as traders resort to repositioning ahead of the high-impact US advance GDP data for the first quarter. 

GBP/USD News

Gold price edges higher amid weaker USD and softer risk tone, focus remains on US GDP

Gold price edges higher amid weaker USD and softer risk tone, focus remains on US GDP

Gold price (XAU/USD) attracts some dip-buying in the vicinity of the $2,300 mark on Thursday and for now, seems to have snapped a three-day losing streak, though the upside potential seems limited. 

Gold News

Injective price weakness persists despite over 5.9 million INJ tokens burned

Injective price weakness persists despite over 5.9 million INJ tokens burned

Injective price is trading with a bearish bias, stuck in the lower section of the market range. The bearish outlook abounds despite the network's deflationary efforts to pump the price. 

Read more

US Q1 GDP Preview: Economic growth set to remain firm in, albeit easing from Q4

US Q1 GDP Preview: Economic growth set to remain firm in, albeit easing from Q4

The United States Gross Domestic Product (GDP) is seen expanding at an annualized rate of 2.5% in Q1. The current resilience of the US economy bolsters the case for a soft landing. 

Read more

Forex MAJORS

Cryptocurrencies

Signatures